研究之中,找到我們是誰 | 中央研究院(2025年版形象影片)
空拍
院區風景
圖書館
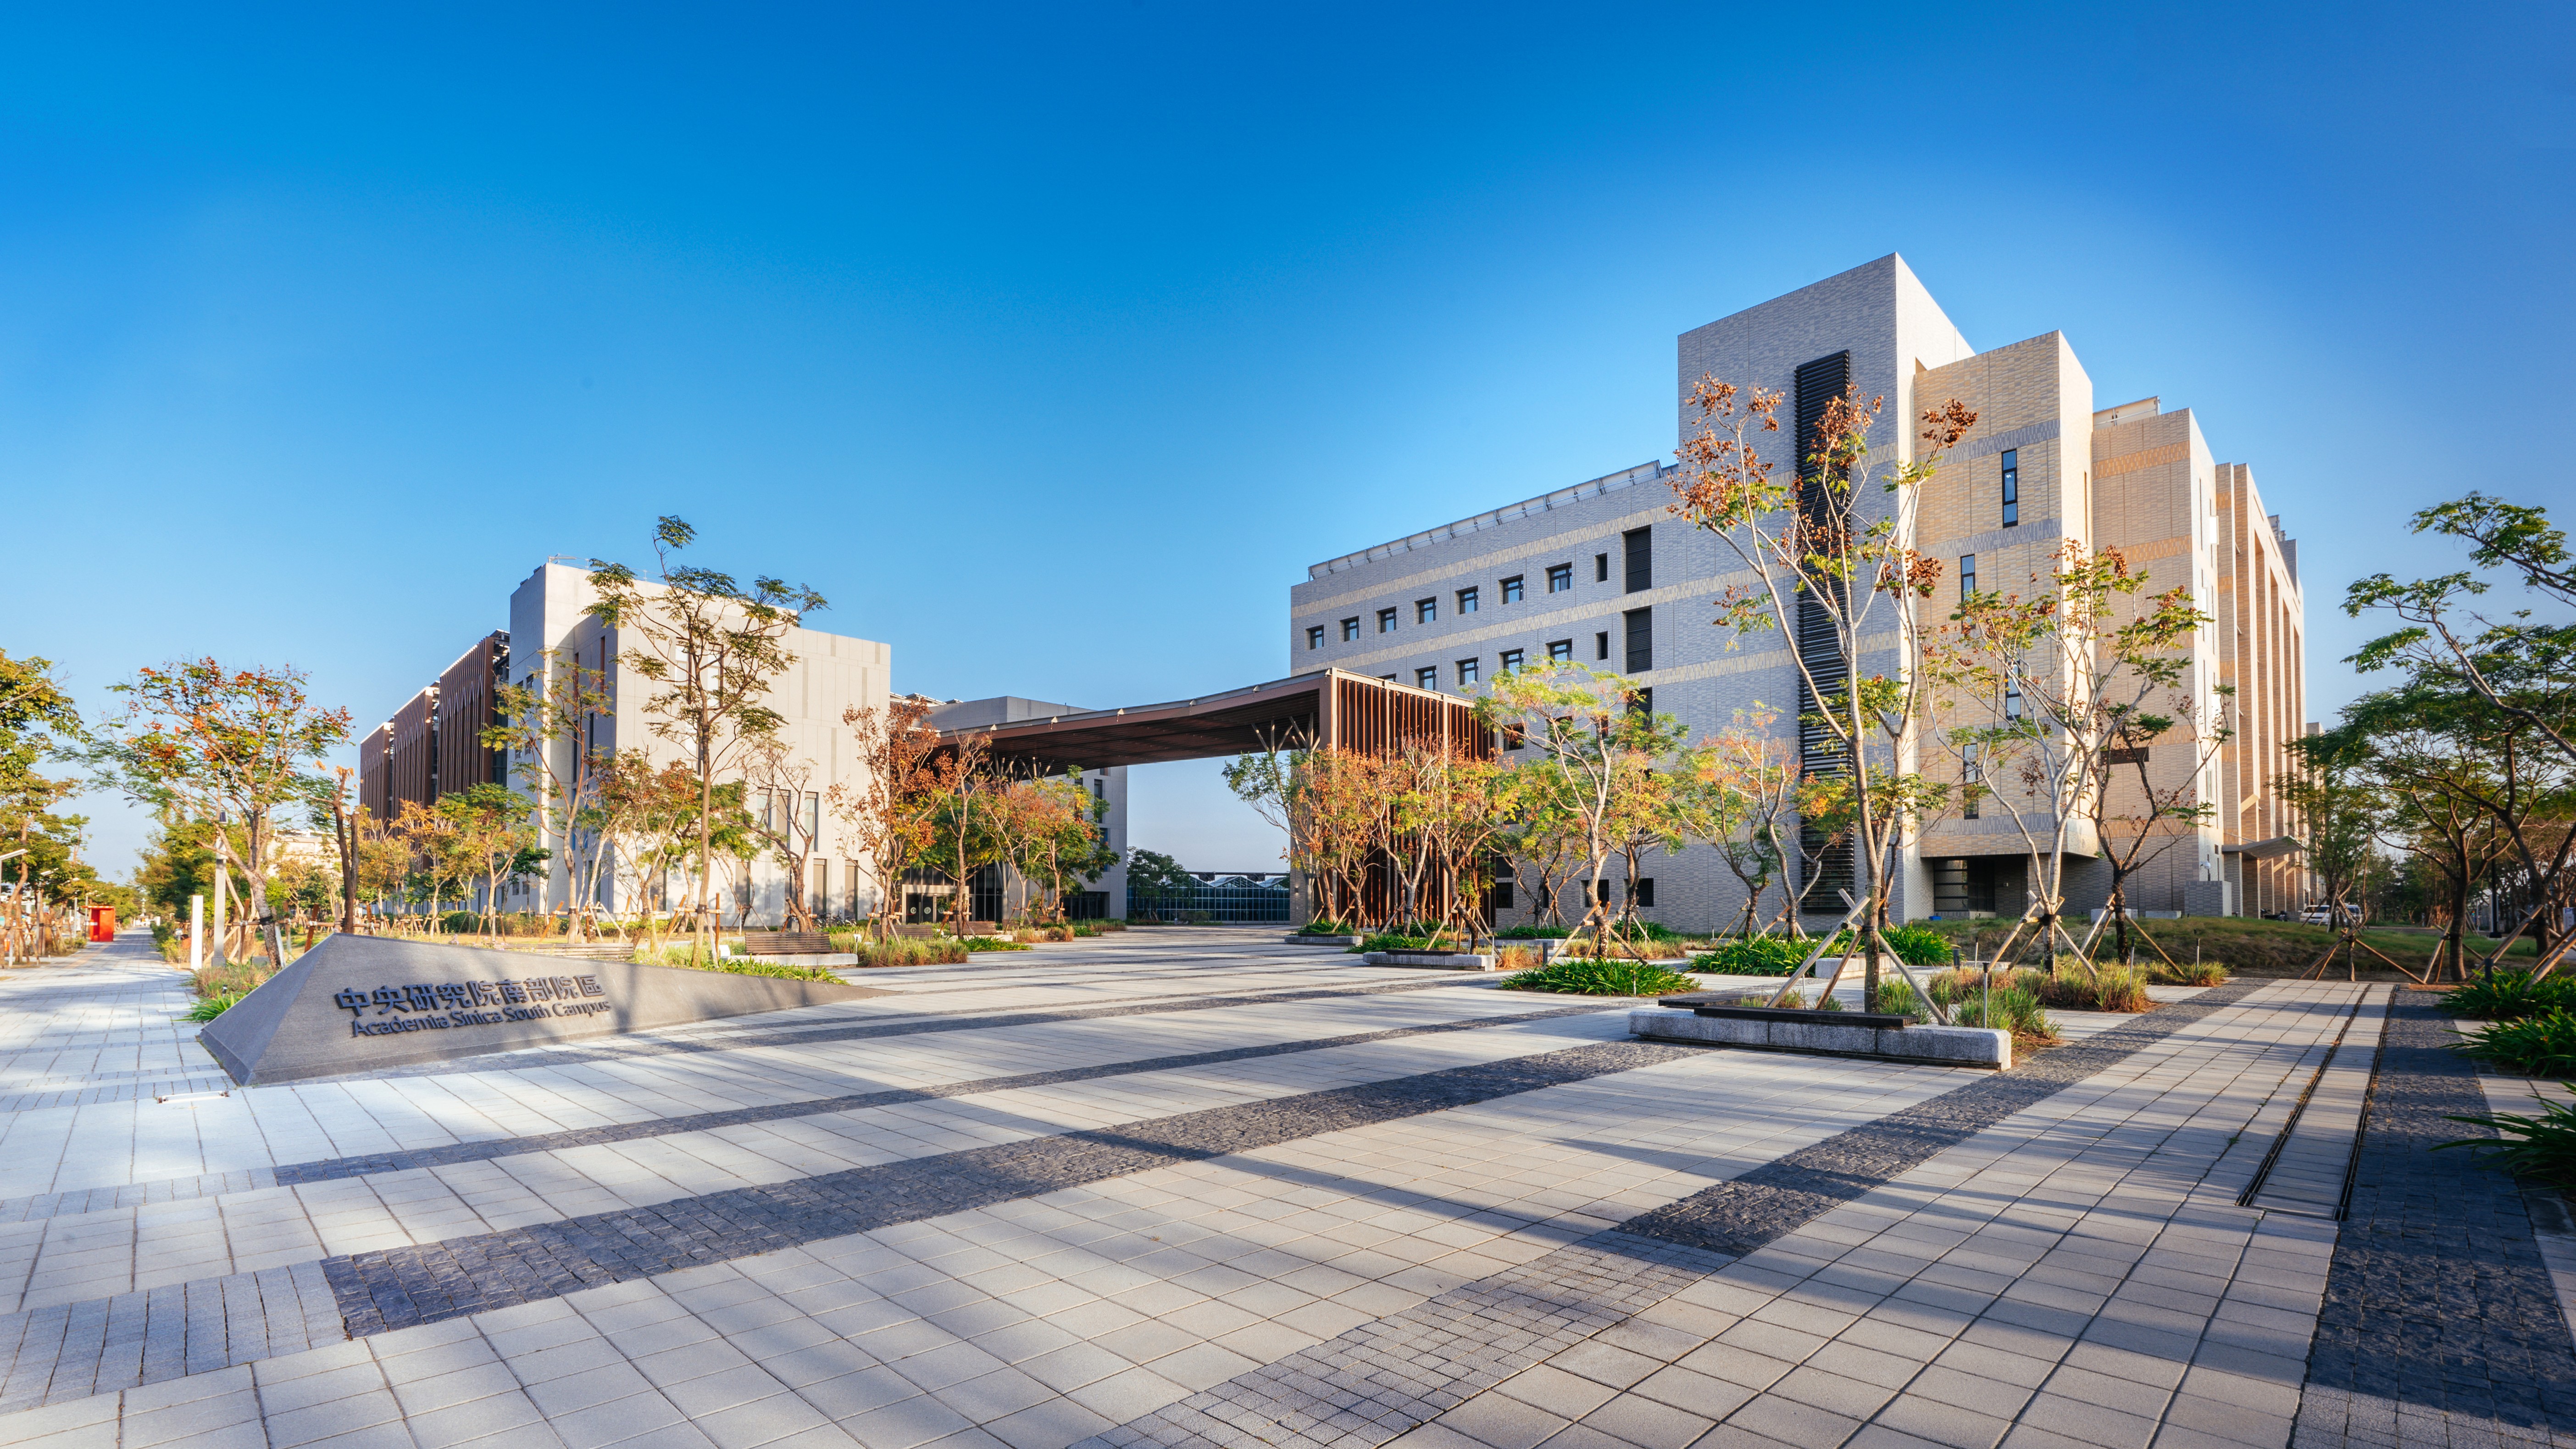
南部院區
聲明專區
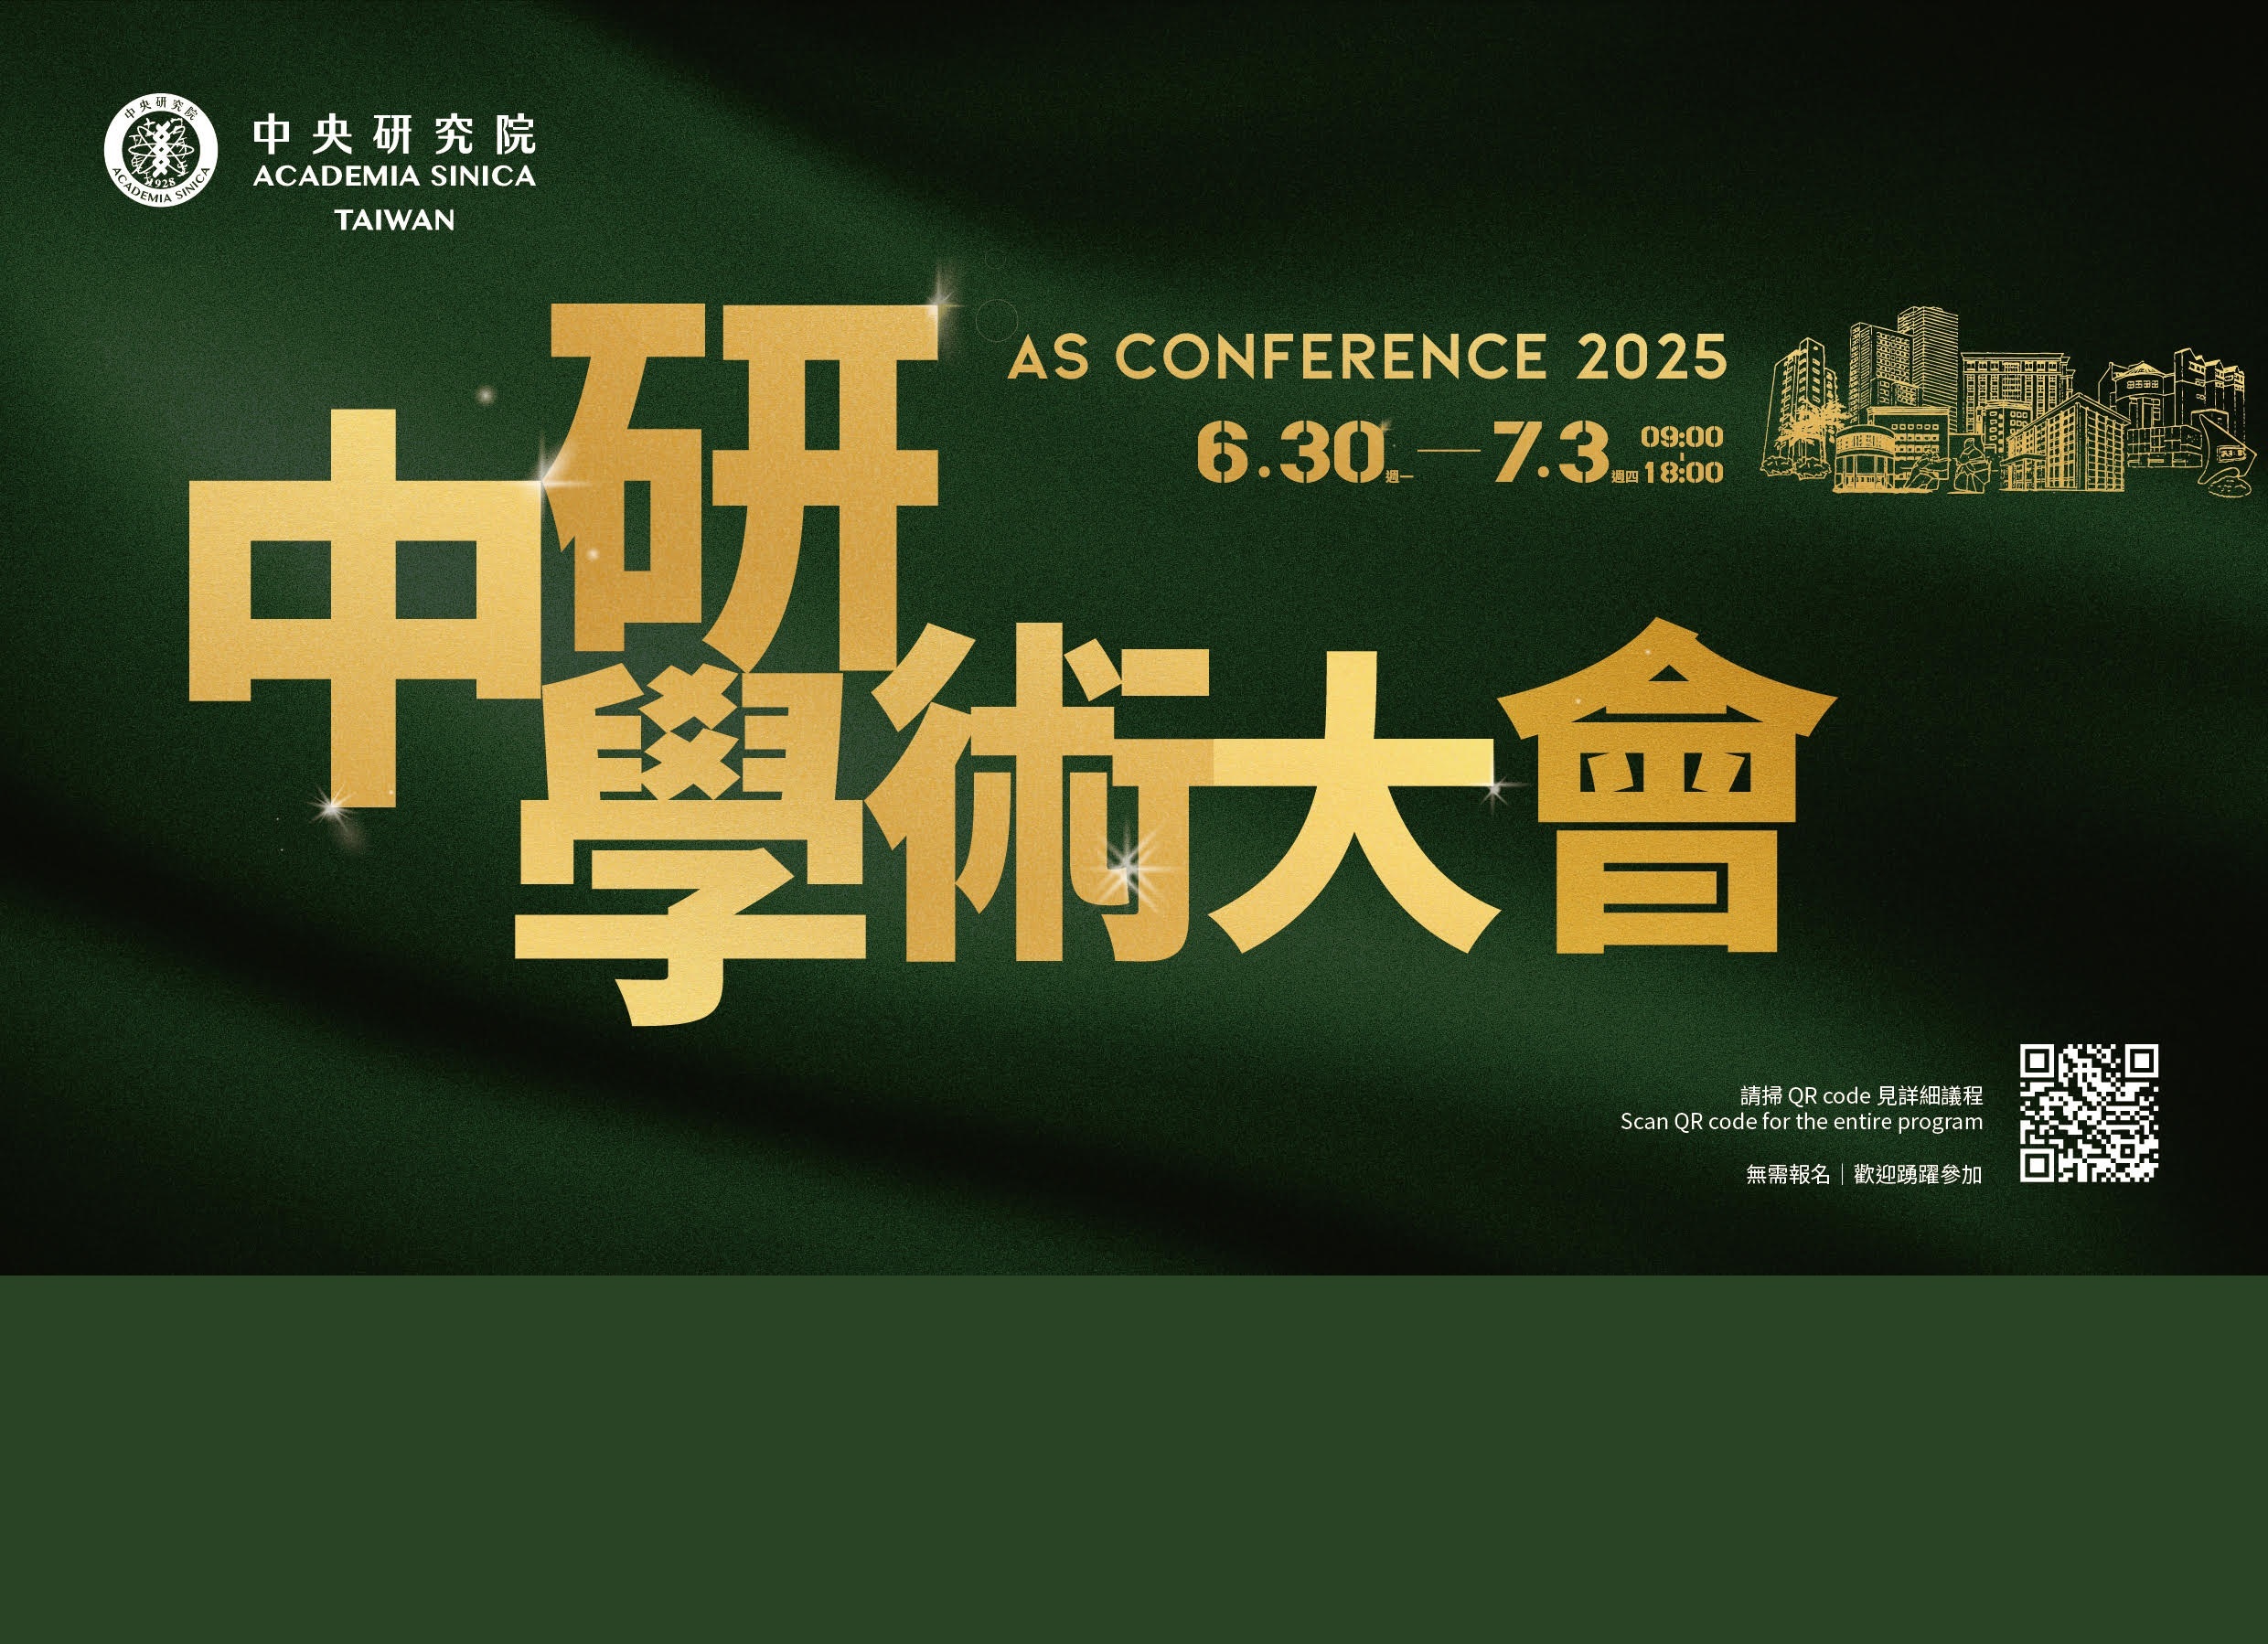
中研院學術大會
中央研究院陳建仁院長昨(14)日與澳洲眼科研究中心(Centre for Eye Research Australia, CERA)訪問團舉行雙邊會談,由執行董事基思・馬丁教授(Keith Martin)率團與會,雙方就精準醫療、研究資源共享及跨機構交流等議題交換意見,並探討未來合作方向。陳院長表示,中研院長期致力於推動基礎研究,並持續建構支援前瞻生物醫學研究的重要平台與資源,期盼透過國際合作,整合研究機構、醫療體系及產業界的優勢,共同推動精準醫療發展,加速研發成果轉譯,增進人類健康福祉。
中央研究院生醫轉譯研究中心(BioTReC)與生物技術開發中心(DCB) 於本(7)月13日至14日在國家生技研究園區共同舉辦「2026 NBRP Demo & Pitch Day」,集結24組具發展潛力的生醫團隊,經專業評審遴選,選出優秀團隊,肯定其在技術創新、臨床應用及市場發展潛力上的卓越表現,並為後續技術落地與產業合作奠定基礎。
2026年上半年,全球經濟面臨中東地緣政治衝突、能源供應鏈不穩及美國關稅政策等挑戰,但在人工智慧應用需求快速擴增帶動下,臺灣出口、投資及金融市場表現亮眼,推升第1季經濟成長率達14.55%,凸顯臺灣經濟在全球科技需求循環中的強勁擴張力道。下半年全球AI投資預期將持續擴張,可望支撐我國出口延續高速成長態勢,加以民間消費穩定成長,內外需共同挹注經濟成長。綜合上述因素,我們預期2026年經濟成長率為10.16%,較去年12月預測值3.71%上修6.45個百分點。國內需求與國外淨需求對經濟成長之貢獻,分別為5.03個百分點與5.13個百分點。
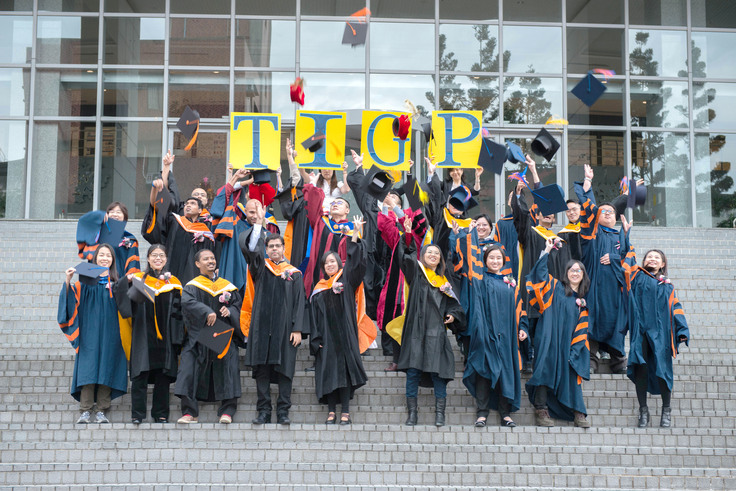
中央研究院8日晚間舉辦院士會議藝文活動《經典之夜》,由台北愛樂管弦樂團擔綱演出,邀請國內外院士、本院同仁及臺灣國際研究生學程(Taiwan International Graduate Program, TIGP)學生共襄盛舉。為期四天的院士會議內容緊湊,本院特別安排這場音樂饗宴,以具有臺灣意象的曲目,串聯來自不同國家、世代與專業領域的學人,為院士會議增添知性與人文交融的氛圍。
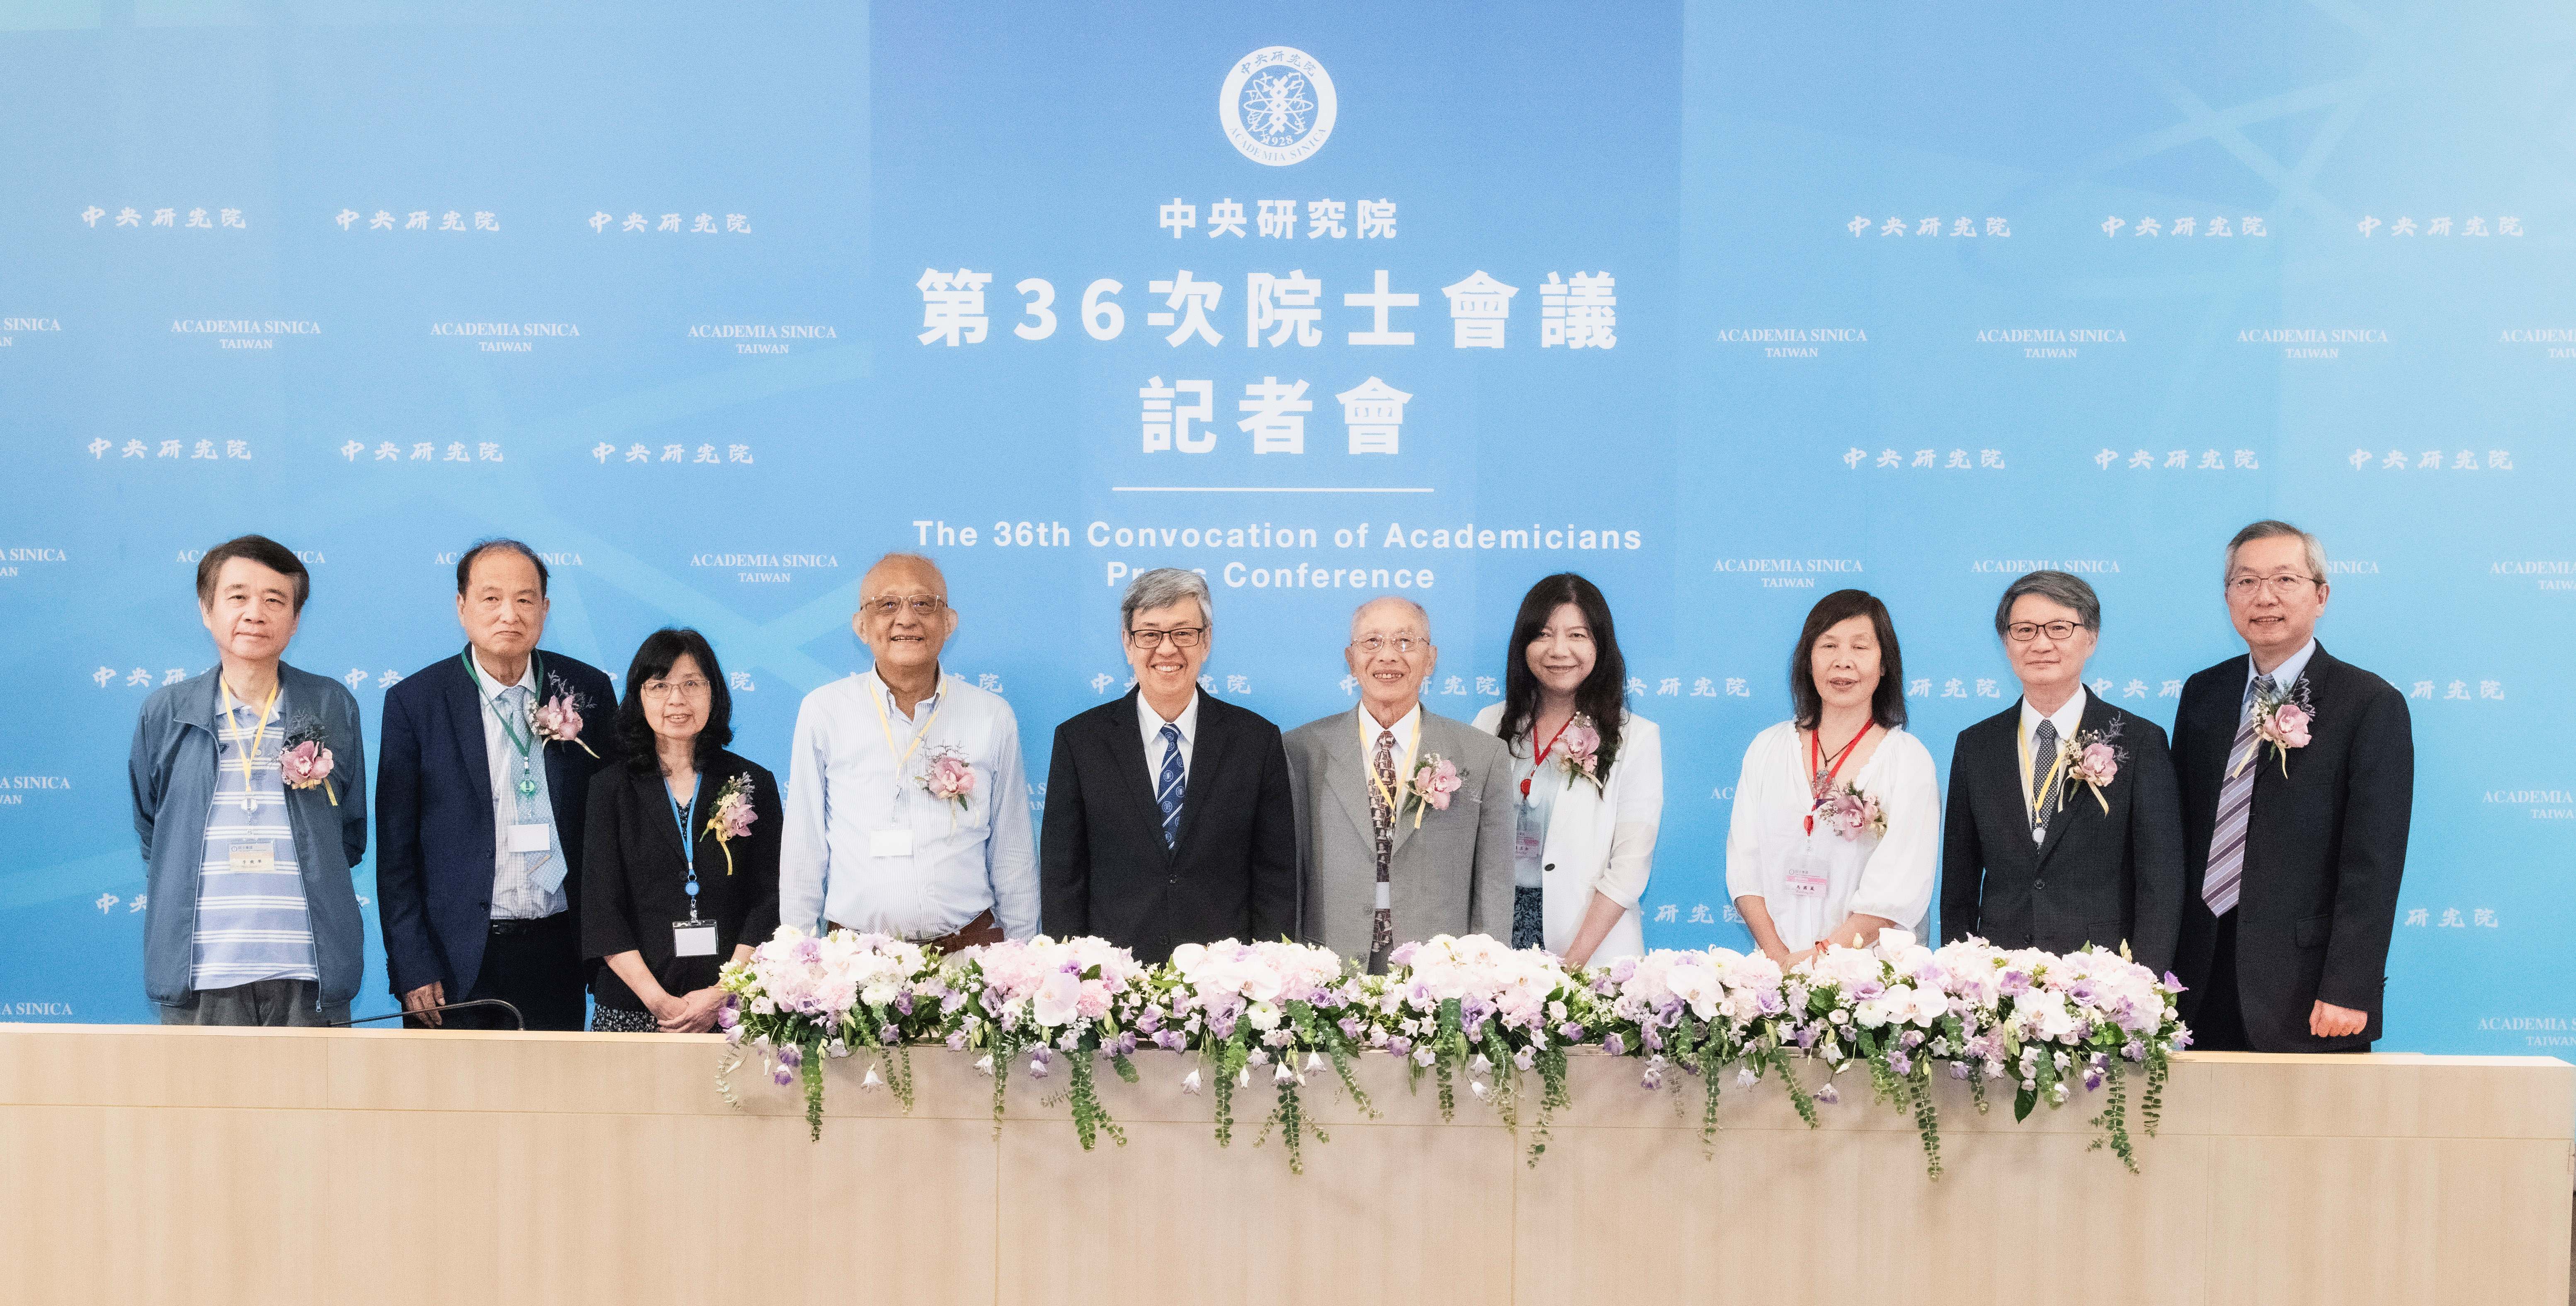
中央研究院第35屆院士暨名譽院士名單揭曉,由陳建仁院長與院士會議四組召集人於今(9)日會後記者會中共同宣布選舉結果,共選出19位新科院士、3位名譽院士。其中女性院士8人、名譽院士均為女性,女性當選人數為歷年最多。
中央研究院第36次院士會議今(6)日下午舉行專題討論,邀請國家科學及技術委員會吳誠文主任委員與教育部鄭英耀部長,分別以「開創國家科研發展新局」及「鏈結全球、布局未來:臺灣新世代人才培育與國際共創」為題,聚焦臺灣科研政策與人才戰略的政策方向,與院士相互交流。
中央研究院第36次院士會議今(6)日邀請中研院名譽院士、美國國家工程學院(National Academy of Engineering, NAE)前院長、伊利諾理工學院前校長約翰.安德森(John L. Anderson),以及中研院院士、美國國家工程學院院長劉金智潔(Tsu-Jae King Liu)發表主題演講,並由本院廖俊智前院長與周美吟副院長共同與談。
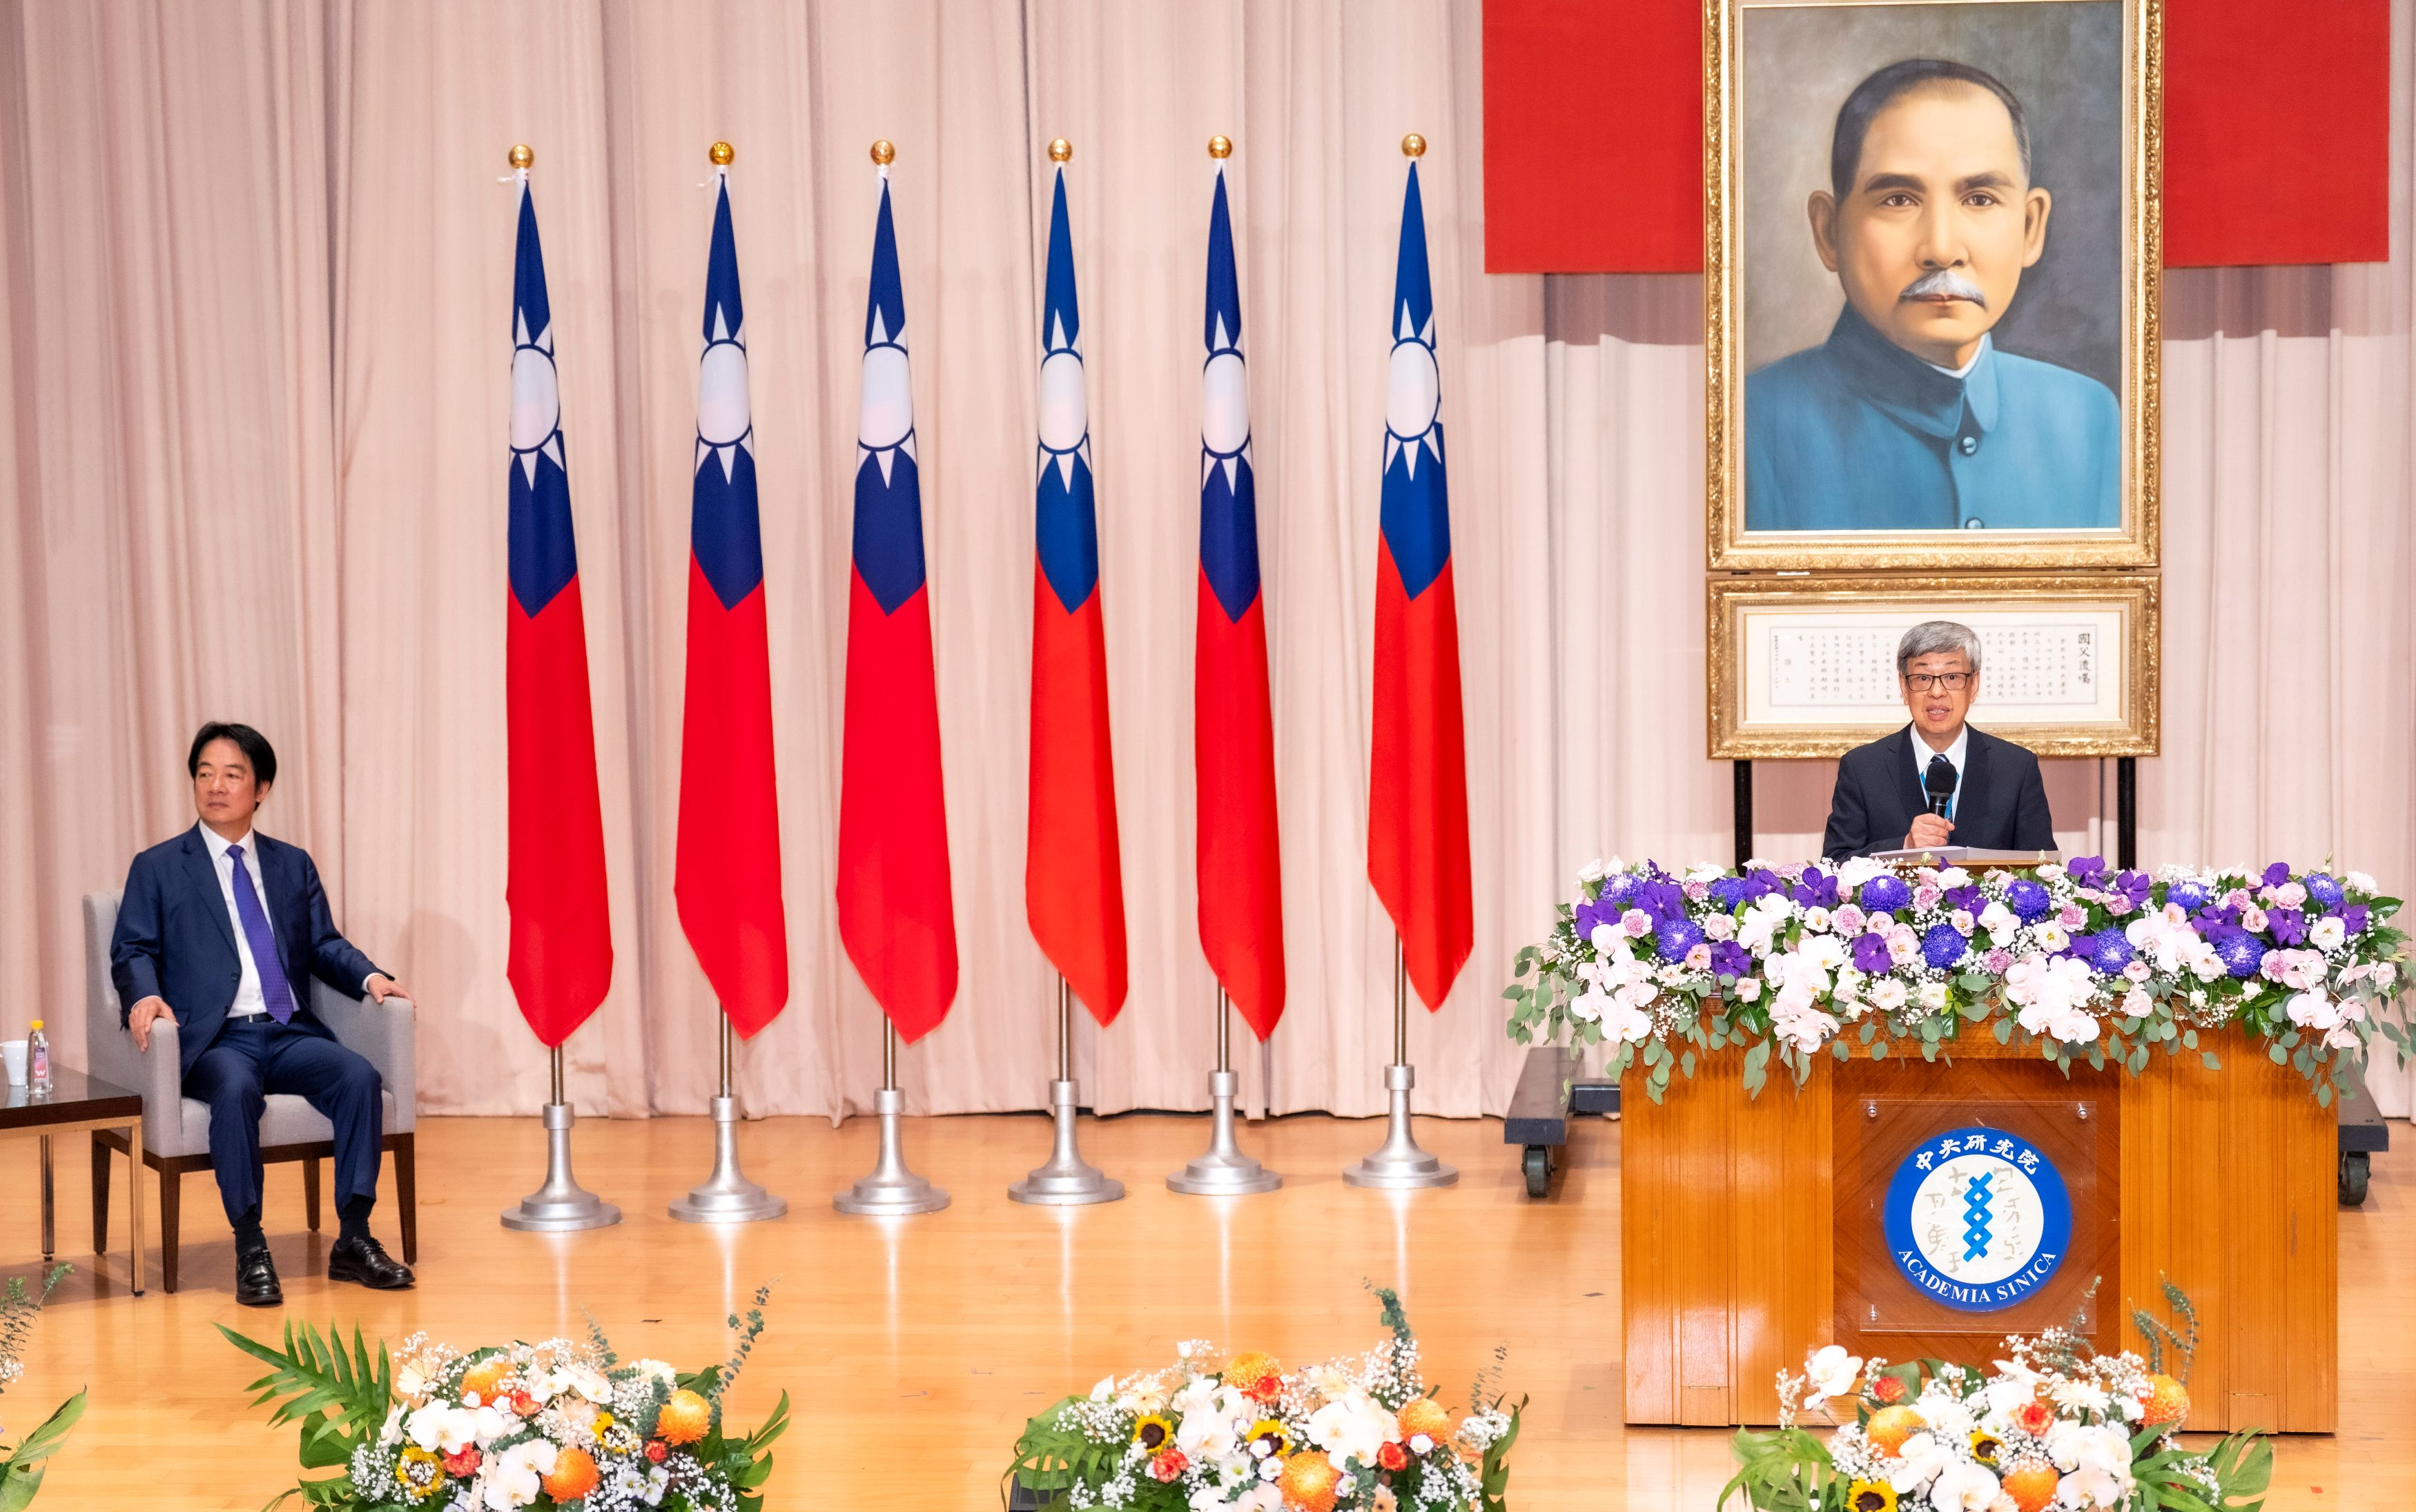
中央研究院第36次院士會議今(6)日正式開幕,超過200位海內外院士齊聚臺灣,共同關心國家學術發展與科研未來。為期4天的會議舉行院士證章頒發、主題演講、專題討論等,並將選出第35屆院士暨名譽院士。陳建仁院長於開幕典禮致詞表示,本次院士會議是他接任院長後首次主持的大型學術盛會。中研院即將迎來創院百年,站在邁向第二個百年的重要起點,期盼與全體院士及同仁攜手並進,以智慧推動頂尖研究,以勇氣帶動創新突破,以慈悲帶來人文關懷,使中研院持續發揮學術引領角色,成為亞太卓越研究重鎮,並透過知識創新回應國家與全球面臨的重要挑戰。
中央研究院將於今(6)日至9日舉行第36次院士會議。依循歷屆傳統,昨(5)日晚間以「仲夏夜音樂會」揭開院士會議序幕,邀請國內外院士、貴賓及院內同仁齊聚,以音樂交流情誼。除了享有盛譽的中央研究院合唱團擔綱演出,本次更有多位院士登臺獻藝,展現科學家的人文風采,與現場來賓共度知性的仲夏夜饗宴。
中央研究院陳建仁院長昨(2)日出席本院社會學研究所「學術諮詢委員會議暨30週年慶」活動,會中邀請美國杜克大學社會學系榮休教授林南院士、美國普林斯頓大學社會學及國際研究講席教授謝宇院士,以及多位學術諮詢委員與會,回顧並展望社會學研究與國際交流的發展方向。
中央研究院陳建仁院長近日接見蒙古科學院生物研究所(Institute of Biology, Mongolian Academy of Sciences)Gantulga Davaakhuu所長訪團,雙方就公共衛生政策、病毒性肝炎防治、生物醫學研究及人才培育議題深入交流。本院生物化學研究所、生物多樣性研究中心、國立宜蘭大學生物資源學院,與蒙古科學院生物研究所四方也共同簽署合作備忘錄,建立長期合作機制。陳院長表示,中研院長期重視國際合作,此次攜手國立宜蘭大學,結合研究機構與大學的科研量能,展現跨界資源整合的成果,並象徵臺蒙科學合作邁向新里程碑,共同推動研究計畫、人員互訪及人才培育。
由中央研究院協辦、國立自然科學博物館(下稱科博館)主辦的「看見典範:臺灣科研創新與成就」特展今(1)日盛大開幕,帶領民眾走近12位中研院院士的科研人生。陳建仁院長表示,感謝科博館策劃此次展覽,透過深入淺出的方式介紹不同科學背景院士的學思歷程,讓社會大眾認識科學家的工作如何探索未知,回應自然、健康與環境等人類共同面臨的挑戰。
學術及儀器事務處
2026/07/21
115年度第2梯次本院新增關鍵突破種子計畫核定公告
天文及天文物理研究所
濃縮恆星百萬年誕生歷程 中研院水墨動畫《行雲流水》獲邀於紐約「Beyond Digital」展出
國際事務處
2026/07/20
中央研究院2026年國際研究生學程錄取公告
秘書處
2026/07/17
中研院藝文活動〉微笑唸歌團:唸歌走江湖
歷史語言研究所
2026/07/14
徵件〉數位文化中心116年度數位人文研究計畫
2026/07/13
本院「116年度第1梯次博士後研究學者」自本(115)年8月1日(六)起至9月1日(二)17時止(臺灣時間)受理線上申請
116年度第1梯次本院新增「關鍵突破種子計畫」即日起受理申請
2026/07/03
專題演講「AI如何學會思考?從大腦到人工智慧的探索」
人事室
2026/06/25
本院語言學研究所所長由研究員曾淑娟博士接任,陳院長主持交接典禮。
2026/06/17
中央研究院與阿曼國立科技大學簽署合作備忘錄 深化學術與研究合作
近代史研究所
2026/06/16
近史所檔案館開放中西醫書及醫案 推動醫療公衛史研究
原子與分子科學研究所
2026/06/15
徵件〉116年度本院「材料與分析科技探索計畫」,即日起受理申請
2026/06/10
本院115年模範公務人員暨工作績優人員獲選名單與個人優良事蹟表
2026/06/01
中央研究院115年度第一次醫學研究倫理教育訓練
2026/05/25
116年度「國立臺灣大學與中央研究院創新性合作計畫」即日起至115年7月10日止受理申請
2026/05/22
近代史研究所陳冠任助研究員獲選英國皇家歷史學會會士
2026/05/21
115年度「中央研究院人文社會科學博士候選人培育計畫核定名單」
2026/05/15
2026-2027年度本院與波蘭科學院共同徵求國際合作計畫核定公告
2026/05/13
中研院藝文活動〉高雄市管樂團:《跨樂一甲子》流行音樂會
2026年中央研究院藝文活動表演資訊
2026/05/08
2026年「第34屆新科院士演講」系列活動訂5月15日至9月29日舉行
2026/05/04
116年度本院新增任務導向生技研究計畫及因應流行病研究計畫,即日起受理申請
2026/05/01
本院即日起至115年6月12日止受理志願服務人員報名
社會學研究所
2026/04/30
研究調查〉「臺灣社會變遷基本調查計畫」第九期第二次正式面訪調查
2026/04/27
活動報名〉2026年知識饗宴 —朱家驊院長科普講座「量子科技與奈米科技對於現代文明的發展」
中央研究院「人文社會科學博士生菁英獎學金」自115年5月15日起至6月15日止受理線上申請,逾期恕不受理。
2026/04/16
「臺灣橋梁計畫」諾貝爾獎得主系列講座「基礎科學之國際合作:實務 經驗分享」
2026/04/15
本院地球科學研究所所長由特聘研究員馬國鳳博士接任,廖院長主持交接典禮。
2026/04/14
本院職場友善辦公室成立 打造安心溝通新管道
基因體研究中心
2026/04/10
陳建仁院士榮獲2026年亞太肝臟研究學會(APASL)Okuda-Omata傑出奬
2026/04/08
曾志朗院士於第14屆華人心理學家學術研討會獲頒2026年「終身成就獎」
2026/03/26
「臺灣橋梁計畫」諾貝爾獎得主系列講座「生命分子、人工智慧與人類 健康」
2026/03/24
有學有術,鑑往知來:沙崙會議揭開百年院慶序幕
永續科學中心
2026/03/18
活動後記〉2026淨零城市展:中研院淨零及AI科研落地,能源大師Amory Lovins重磅開講!
2026/03/12
「臺灣橋梁計畫」諾貝爾獎得主系列講座「大腦的 GPS:我們如何知道 自己身在何處」
2026/03/02
活動報名〉2026年知識饗宴—王世杰院長科普講座 「當臺灣人遇上中國人與美國人:我們如何看待這段微妙的三角關係?」
關鍵議題研究中心
2026/02/26
本院關鍵中心成立「下世代高效太陽能電池技術合作聯盟」
2026/02/25
116年度本院新增前瞻計畫、深耕研究計畫、主題研究計畫、關鍵突破研究計畫即日起受理申請
2026/02/13
活動報名〉「臺灣橋梁計畫」諾貝爾獎得主系列講座「抗體革命」
本院歷史語言研究所所長由研究員陳正國博士接任,廖院長主持交接典禮。
2026/02/11
活動報名〉2026年知識饗宴—錢思亮院長科普講座 「施肥不施肥?—植物的糧食、人類的糧食與環境的永續」
2026/02/10
研究調查〉「臺灣社會變遷基本調查計畫」第九期第二次預試面訪調查
2026/02/03
活動報名〉「臺灣橋梁計畫」諾貝爾獎得主系列講座「什麼是生命?」
民族學研究所
期刊出版〉《民族學研究所資料彙編》第31期
2026/01/30
活動報名〉「中央研究院講座」2025年諾貝爾物理學獎得主演講「量子運算的產業轉型:從科研邁向產業」
2026/01/29
活動報名〉「臺灣橋梁計畫」諾貝爾獎得主系列講座「為什麼你應該喜愛基因改造食品」
化學研究所
化學所陳玉如特聘研究員榮獲HUPO「傑出蛋白質體學成就獎」
出版中心
2026/01/20
展覽訊息〉2026台北國際書展:「藍圖(Blueprint)」主題特展
2026/01/19
活動報名〉「臺灣橋梁計畫」諾貝爾獎得主系列講座「是否存在「B行星 」?—人類會移居到系外行星嗎?」
2026/01/09
活動報名〉「臺灣橋梁計畫」諾貝爾獎得主系列講座「雷射與量子物理 」
2026/01/05
研究調查〉「臺灣社會變遷基本調查計畫」第九期第一次正式面訪調查(延長公告)
2025/12/29
115年度「人文社會科學博士候選人培育計畫」自即日起受理申請
2025/12/23
活動報名〉2026年知識饗宴—蔡元培院長科普講座 「你與人工智慧:與科技共進」
生物多樣性研究中心
2025/12/22
臺灣生物多樣性資訊機構 (TaiBIF) 榮獲2025年GBIF「全球生物多樣性資訊節點獎」 肯定臺灣全球生物多樣性資料共享之貢獻
書籍出版〉《知識的幾何與光影:中央研究院建築選》
2025/12/18
國科會114年度傑出特約研究員本院獲獎名單
2025/12/10
預告修正「臺灣人體生物資料庫資料及檢體使用收費標準」
2025/12/08
活動後記〉「台灣海洋碳移除方法工作坊」圓滿成功
2025/12/03
本院分子生物研究所陳詩允助研究員獲選為歐洲分子生物組織年輕研究學者(EMBO Young Investigator)
2025/11/21
近史所與國防大學簽署學術交流備忘錄 促進戰爭與軍事史合作
活動報名〉「臺灣橋梁計畫」諾貝爾獎得主系列講座「誰能推動全球衝突相關性暴力(CRSV)的終結?— 個人故事的力量與行動主義的角色 」
活動報名〉2025年知識饗宴—胡適院長科普講座 「觸受之眼:VR電影的感官邂逅」
2025/11/18
活動後記〉「2025 AI 引領永續社會國際學術研討會暨政策實務論壇」圓滿成功
2025/11/05
活動報名〉「臺灣橋梁計畫」諾貝爾獎得主系列講座「疾病的終結?—生物醫學的非凡發展及其對人類的意涵」
2025/11/01
本院115年度「國際研究生學程(TIGP)」開始受理申請
2025/10/29
活動報名〉2025年度中央研究院講座 「黑洞:跨越學科的交會點」
2025/10/28
本院生醫轉譯研究中心主任由研究員陳建璋先生接任,廖院長主持交接典禮。
2025/10/23
中研院菁英博士生快速入學試行計畫 助青年學子延續科研之路
2025/10/08
再赴法蘭克福書展 中研院以多元學術視野開啟全球交流對話
2025/09/30
中研院自製量子計算測試平台開放申請使用
2025/09/17
原子與分子科學研究所許良彥研究員榮獲美國物理聯合會《化學物理雜誌》2024年度新興研究者最佳論文獎
人文社會科學研究中心
2025/09/16
活動後記〉「2025中研GIS論壇」圓滿成功
2025/09/15
114年度中央研究院人文社會科學博士生菁英獎學金 共計21名同學獲獎
2025/09/02
研究調查〉「網路徵才詐騙:過度自信與數位素養對使用者之影響的比較研究」網路調查
2025/08/27
基因轉殖鼠核心設施_推廣與教育訓練
2025/08/20
研究調查〉「傳播調查資料庫第三期第四次青少年」調查計畫
2025/08/13
活動報名〉2025年知識饗宴—吳大猷院長科普講座 「探索花朵美麗之謎」
2025/08/08
115年度本院新增「淨零科技研發計畫」即日起至114年10月8日止受理申請
2025/08/04
本院114年模範公務人員暨工作績優人員頒獎典禮業於114年7月25日辦理完竣,茲將本年度獲獎人員之優良事蹟刊登本院網頁公開表揚
2025/07/31
研究調查〉家庭動態調查「2025年預試調查」
2025/07/23
活動後記〉本院攜手UCLA、京都大學合辦 三邊生醫研討會
2025/07/22
本院化學研究所陳玉如特聘研究員榮獲財團法人台灣生技醫藥發展基金會「115年學術講座」
語言學研究所
2025/07/21
《語言暨語言學》期刊新任編輯團隊公告
活動後記〉2025臺灣數位世代研究第二屆國際學術研討會
2025/07/17
研究調查〉「民眾對公聽會的參與意願與想法」網路調查
研究調查〉「人工智慧應用於刑事司法審判的可能與顧慮」網路調查
研究調查〉「提升臨終醫療中的病人自主權」網路調查
研究調查〉「投資與理財態度調查」網路調查
2025/07/15
活動訊息〉本院第13任院長遴選座談會
2025/07/14
中央研究院114年度第二次醫學研究倫理教育訓練
2025/07/09
本院共3位研究人員榮獲第23屆有庠科技論文獎
活動後記〉首屆「中研學術大會」圓滿落幕,跨域對話激盪合作火花
2025/07/08
中央研究院2025年國際研究生學程錄取公告
2025/07/03
演講全紀錄〉首屆中研學術大會 廖院長開幕演講
2025/06/24
歡迎參加〉本院自6月30日至7月3日首度舉辦「中研學術大會」
2025/06/23
研究調查〉「臺灣社會變遷基本調查計畫」第八期第五次正式面訪調查補訪
研究調查〉「臺灣青少年成長歷程研究」正式面訪調查
115年度本院「材料與分析科技探索計畫」,即日起受理申請
2025/06/19
114年度第2梯次「國內學人短期來院訪問研究」核定通過名單
2025/06/12
114年度第2梯次本院新增關鍵突破種子計畫核定公告
2025/06/10
本院近代史研究所與國家圖書館舊籍數位化合作締約 近代史文獻共享傳播
2025/06/09
本院近代史研究所陳冠任助研究員獲2024北美海洋史學會約翰.萊曼圖書獎
2025/06/06
114年度「中央研究院人文社會科學博士候選人培育計畫」核定名單
2025/06/02
研究調查〉「傳播調查資料庫第三期第四次」面訪調查
2025/05/29
114年度第2梯次博士後研究學者申請案核定通過名單
2025/05/26
本院114年度「胡適紀念研究講座」開始受理申請
2025/05/23
第13任院長遴選委員會-研究人員及研究技術人員代表選舉 候選人名單公告
2025/05/22
中央研究院「人文社會科學博士生菁英獎學金」自114年6月1日起至7月1日止受理線上申請,逾期恕不受理。
2025/05/15
2025-2026年度本院與波蘭科學院共同徵求國際合作計畫核定公告
2025/05/14
研究調查〉「臺灣社會變遷基本調查計畫」第九期第一次正式面訪調查
2025/05/13
本院即日起至114年6月30日止受理志願服務人員報名
2025/04/29
研究調查〉「美中對臺政策」網路調查
2025/04/28
115年度「臺北、臺中、高雄榮民總醫院、三軍總醫院與中央研究院合作研究計畫」,自114年6月2日起至114年7月15日止受理申請
2025/04/23
中央研究院114年度第二次人文社會科學研究倫理教育訓練
2025/04/22
推動居家照護專業與永續發展—「居家護理師專業及經營管理課程」圓滿舉辦
2025/04/21
活動報名〉2025年知識饗宴—朱家驊院長科普講座 「從黑洞觀看宇宙奧秘」
2025/04/18
115年度本院新增永續科學研究計畫即日起受理申請
第12屆院務會議研究人員代表選舉當選人名單公告
2025/04/16
中研院藝文活動〉茱蒂口琴樂團「口琴說書人」
2025/04/15
研究調查〉「探討衛生所的公共衛生效益」網路調查
2025/04/11
本院人事室主任異動
農生中心高階光學顯微鏡核心設施 超解析暨共軛焦顯微鏡(Zeiss ELYRA 7 with LSM 980)服務說明會 &蔡司新機(Lattice SIM 3)展示會
2025/04/02
本院與EMBO合辦「敘述性履歷」工作坊及課程
2025/03/25
研究調查〉「傳播調查資料庫第三期第四次青少年調查預試計畫」
研究調查〉「臺灣民眾之政治社會態度」網路調查
2025/03/21
本院細胞與個體生物學研究所王漢津助研究員榮獲2024年美國李氏傳統基金會獎助金
2025/03/20
第12屆院務會議研究人員代表選舉公告
本院民族學研究所所長由研究員周玉慧博士接任,廖院長主持交接典禮。
2025/03/17
中研院藝文活動〉微光古樂集「大航海時代的古樂」
2025/03/13
中央研究院114年度第一次人文社會科學研究倫理教育訓練
中央研究院114年度第一次醫學研究倫理教育訓練
Team AS!行政團隊工作效率再升級 全力支援研究
2025/03/10
本院114年度第2梯次「獎勵國內學人短期來院訪問研究」即日起至114年4月18日受理線上申請
2025/03/05
研究調查〉「社群媒體使用」網路調查
2025/03/04
國家科學及技術委員會113年度傑出研究獎本院獲獎名單
2025/02/28
114年「國際研究生學程(TIGP)暑期實習計畫」錄取名單
2025/02/27
活動報名〉2025年知識饗宴—王世杰院長科普講座 「從民調看臺灣民眾的防衛意志」
2024/12/25
中研院新進研究人員交流會 — 鼓勵合作 跨出舒適圈 挑戰新問題
2024/12/19
2025-2026年度本院與捷克科學院共同徵求國際合作計畫核定公告
2024/12/06
2024年「中央研究院年輕學者研究成果獎」訂於12月9日舉行頒獎典禮
2024/12/02
新書出版〉《研之有物:格物窮理!中研院的 25 堂數理科學課》將舉辦新書分享會
政風室
2024/10/17
本院113年度廉能楷模人員與具體事蹟
2024/09/11
本院113年模範公務人員及工作績優人員獲選名單與個人優良事蹟表
2024/05/09
展望2030年 聚焦願景 提出策略 開始行動
2024/04/09
本院即日起至113年5月31日止受理志願服務人員報名
2024/03/29
113年「國際研究生學程(TIGP)暑期實習計畫」錄取名單
歐美研究所
2024/02/20
美國密西根大學2024年「暑期社會研究量化方法課程」開始報名
2024/01/15
國立臺灣大學林麗瓊院士當選世界科學院2024新任院士
2023/09/13
攜手大學共創雙贏 中研院推「中研學者」計畫
院本部
2023/08/22
院長致同仁信:本院博士生獎助金提升方案
Letter from President Liao to Ph.D. Students: Supplemental Stipends for Academia Sinica Ph.D. Students
人文及社會科學組-人文社會科學研究中心
調查研究專題中心調查訪問組
截止:2026/07/31
生命科學組-分子生物研究所
郭惠思老師實驗室
調查研究專題中心
數理科學組-統計科學研究所
黃彥棕研究員
政府統計研究群
院本部-智財技轉處
商業開發暨授權組
生命科學組-生物醫學科學研究所
Dr.謝小燕(Shieh,Sheau-Yann ) 實驗室
調查研究專題中心謝淑惠研究員研究室
Dr.謝小燕(Shieh,Sheau-Yann)實驗室
截止:2026/08/05
生命科學組-生物化學研究所
翁瑞霞老師實驗室
截止:2026/08/11
楊維元老師實驗室
截止:2026/08/12
林曉青老師實驗室
截止:2026/08/15
史有伶老師實驗室
截止:2026/08/19
人文及社會科學組-民族學研究所
人文及社會科學組-經濟研究所
陳恭平特聘研究員
人文及社會科學組-中國文哲研究所
中研院人文講座辦公室
截止:2026/07/30
人文及社會科學組-政治學研究所
人文館機電室
人文及社會科學組-歐美研究所
PI
09/20~08/20
12:00 總務處
[展覽訊息]2025嶺南畫派來臺半世紀─畫與詩的對話歐豪年九秩紀念大展
10/19~07/31
10:00 生物多樣性研究中心
「生命之礁:珊瑚的奧秘與生機」特展
04/13~08/06
08:00 生物多樣性研究中心
第八屆珊瑚礁生物多樣性與水下生態調查技術研習會 (7/26-8/6,報名至5/31截止)
06/15~07/31
09:00 基因體研究中心
[報名] 2026基因體流行病學研習營 (8/10~14)
07/27
10:00 台灣史研究所
海洋史研究群講論會:史前臺灣的島嶼文化
11:00 生物化學研究所
Decoding the Biosynthesis and Enzymology of Fungal Natural Products
13:00 歷史語言研究所
「蒙藏佛教史」工作坊
07/28~08/18
01:00 人文社會科學研究中心
「北北基桃通勤生活調查」網路調查
07/28
11:00 分子生物研究所
Molecular weapons of interbacterial conflict
14:00 台灣史研究所
【週二演講】:互動的工藝:日治時期台灣工匠與犂具生產
14:00 人文社會科學研究中心
【訪問學人研究成果演講】沒有下一代的民主:辯護父母代理子女投票
14:00 植物暨微生物學研究所
IPMB Seminar: An N-degron proteolytic pathway modulates recipient susceptibility to the type VI secretion system effectors
本院近代史研究所黃克武特聘研究員所著專書《清中葉儒學的經世轉向:《切問齋文鈔》與《皇朝經世文編》》,已於2026年4月出版。
本院語言學研究所期刊《語言暨語言學》第27卷第3期已出版
本院歷史語言研究所編印之Asia Major, Volume 38 Part 1已出版
本院歷史語言研究所編印之《中央研究院歷史語言研究所集刊》第九十七本第二分已出版
本院數學研究所編印之《數學傳播》季刊第50卷第2期已出版。
本院數學研究所編印之《數學集刊》,第21卷第2期已出版。
地球內部約 2,900 公里深處,是地函與地核的交界,稱為地函與地核邊界(core-mantle boundary, CMB)。此區域是地球內部熱量交換的重要關口:地核的熱量會經由此處傳到地函,再隨著地函的對流運動向上傳輸至地表。因此,此區域的熱流變化也會影響地核的冷卻與內部流動,以及產生地球磁場的「地球發電機作用」。
本期「社會脈絡中的意義與實在II」專號共收錄4篇文章
本院人文社會科學研究中心編印之《人文及社會科學集刊》第三十八卷第二期業已出版,本期共收錄6篇論文
本院經濟研究所期刊《經濟論文》第54卷第2期業已出版,本期目錄如下
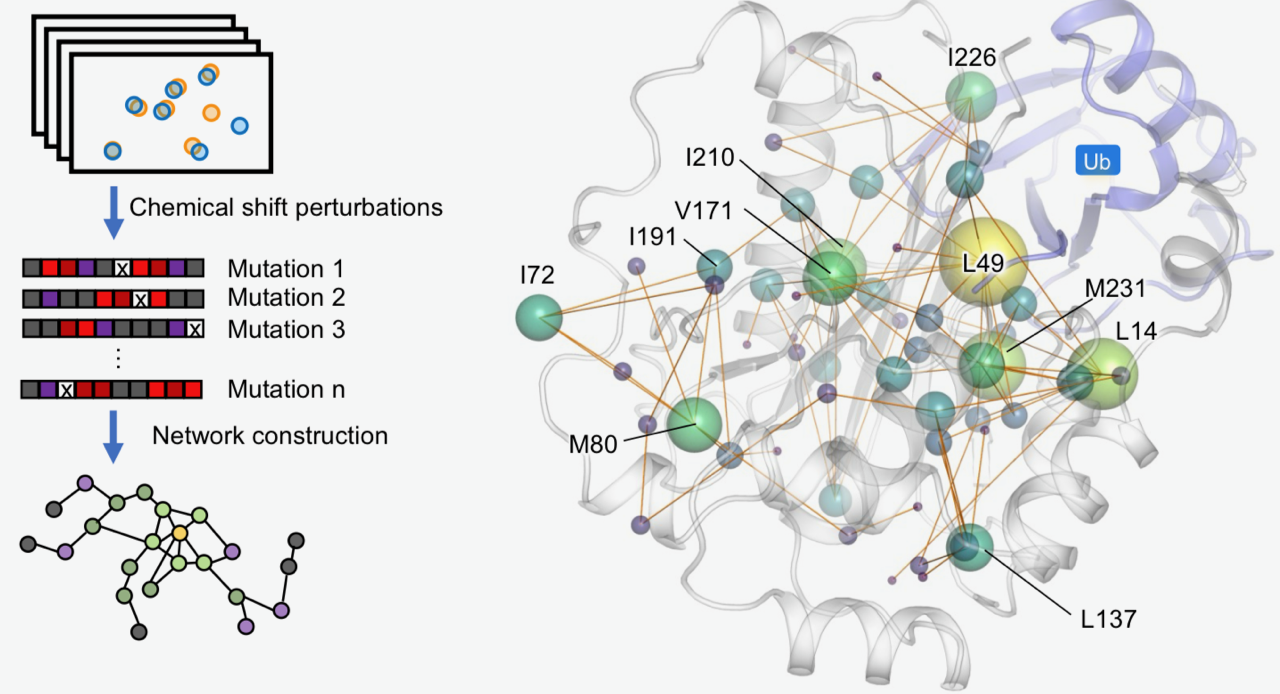
本院生化所徐尚德研究員所領導的研究團隊,結合先進甲基核磁共振(methyl NMR)、蛋白質動態分析與分子模擬技術,首度描繪與多種癌症相關的重要腫瘤抑制蛋白BAP1內部的長距離調控網絡,並系統性解析近五十個癌症相關突變的影響。
本院歐美研究所「中美關係報告」系列最新一本論文集《拜登政府中美關係專題研究》,由本院出版中心於今(2026)年五月出版。本書源自歐美所「拜登政府美中臺關係專題研究」研討會,由歐美所林正義兼任研究員主編,並力邀前總統府秘書長林碧炤教授撰寫序言,集結國內政治學與國際關係領域的學者專家,解析拜登執政時期的地緣政治角力。
「中研院訊」為本院重要資訊及研究成果發布平台,每雙週出刊,協助院內同仁掌握本院最新消息,也讓院外讀者更加了解本院及相關學術研究成果。
「研之有物」為本院創立之科普平臺,以深入淺出的方式報導數理、生命及人文社會領域研究成果,分享研究人員不為人知的甘苦談。歡迎進入官網吸收新知、訂閱電子報,一起探索各領域知識!


.jfif)