公式
院區風景
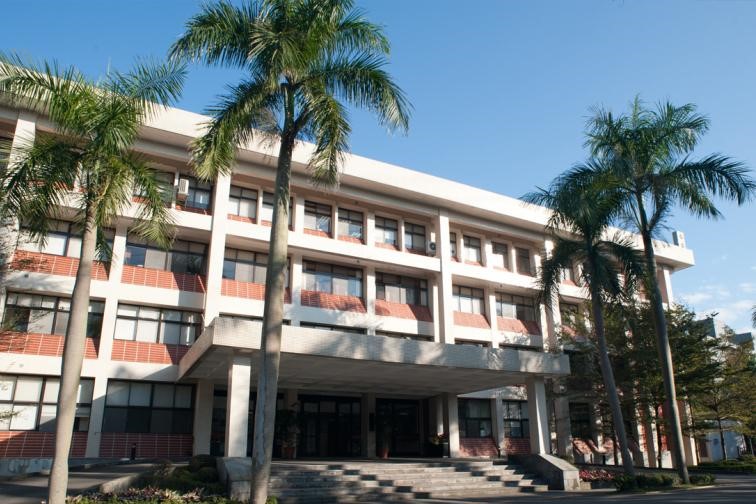
圖書館
南部院區
中央研究院
國寶
量子電腦
聲明專區
中研院學術大會
2026年中央研究院「中研講堂」科普講座前進高雄鳳山高中,從AI、永續農業到民主自由,探討「面對未來的提問與選擇」。這場結合自然科學與人文思辨的講座,吸引逾500名師生與民眾參與,座無虛席。現場同學們踴躍的提問,與3位講者互動,相當精彩。
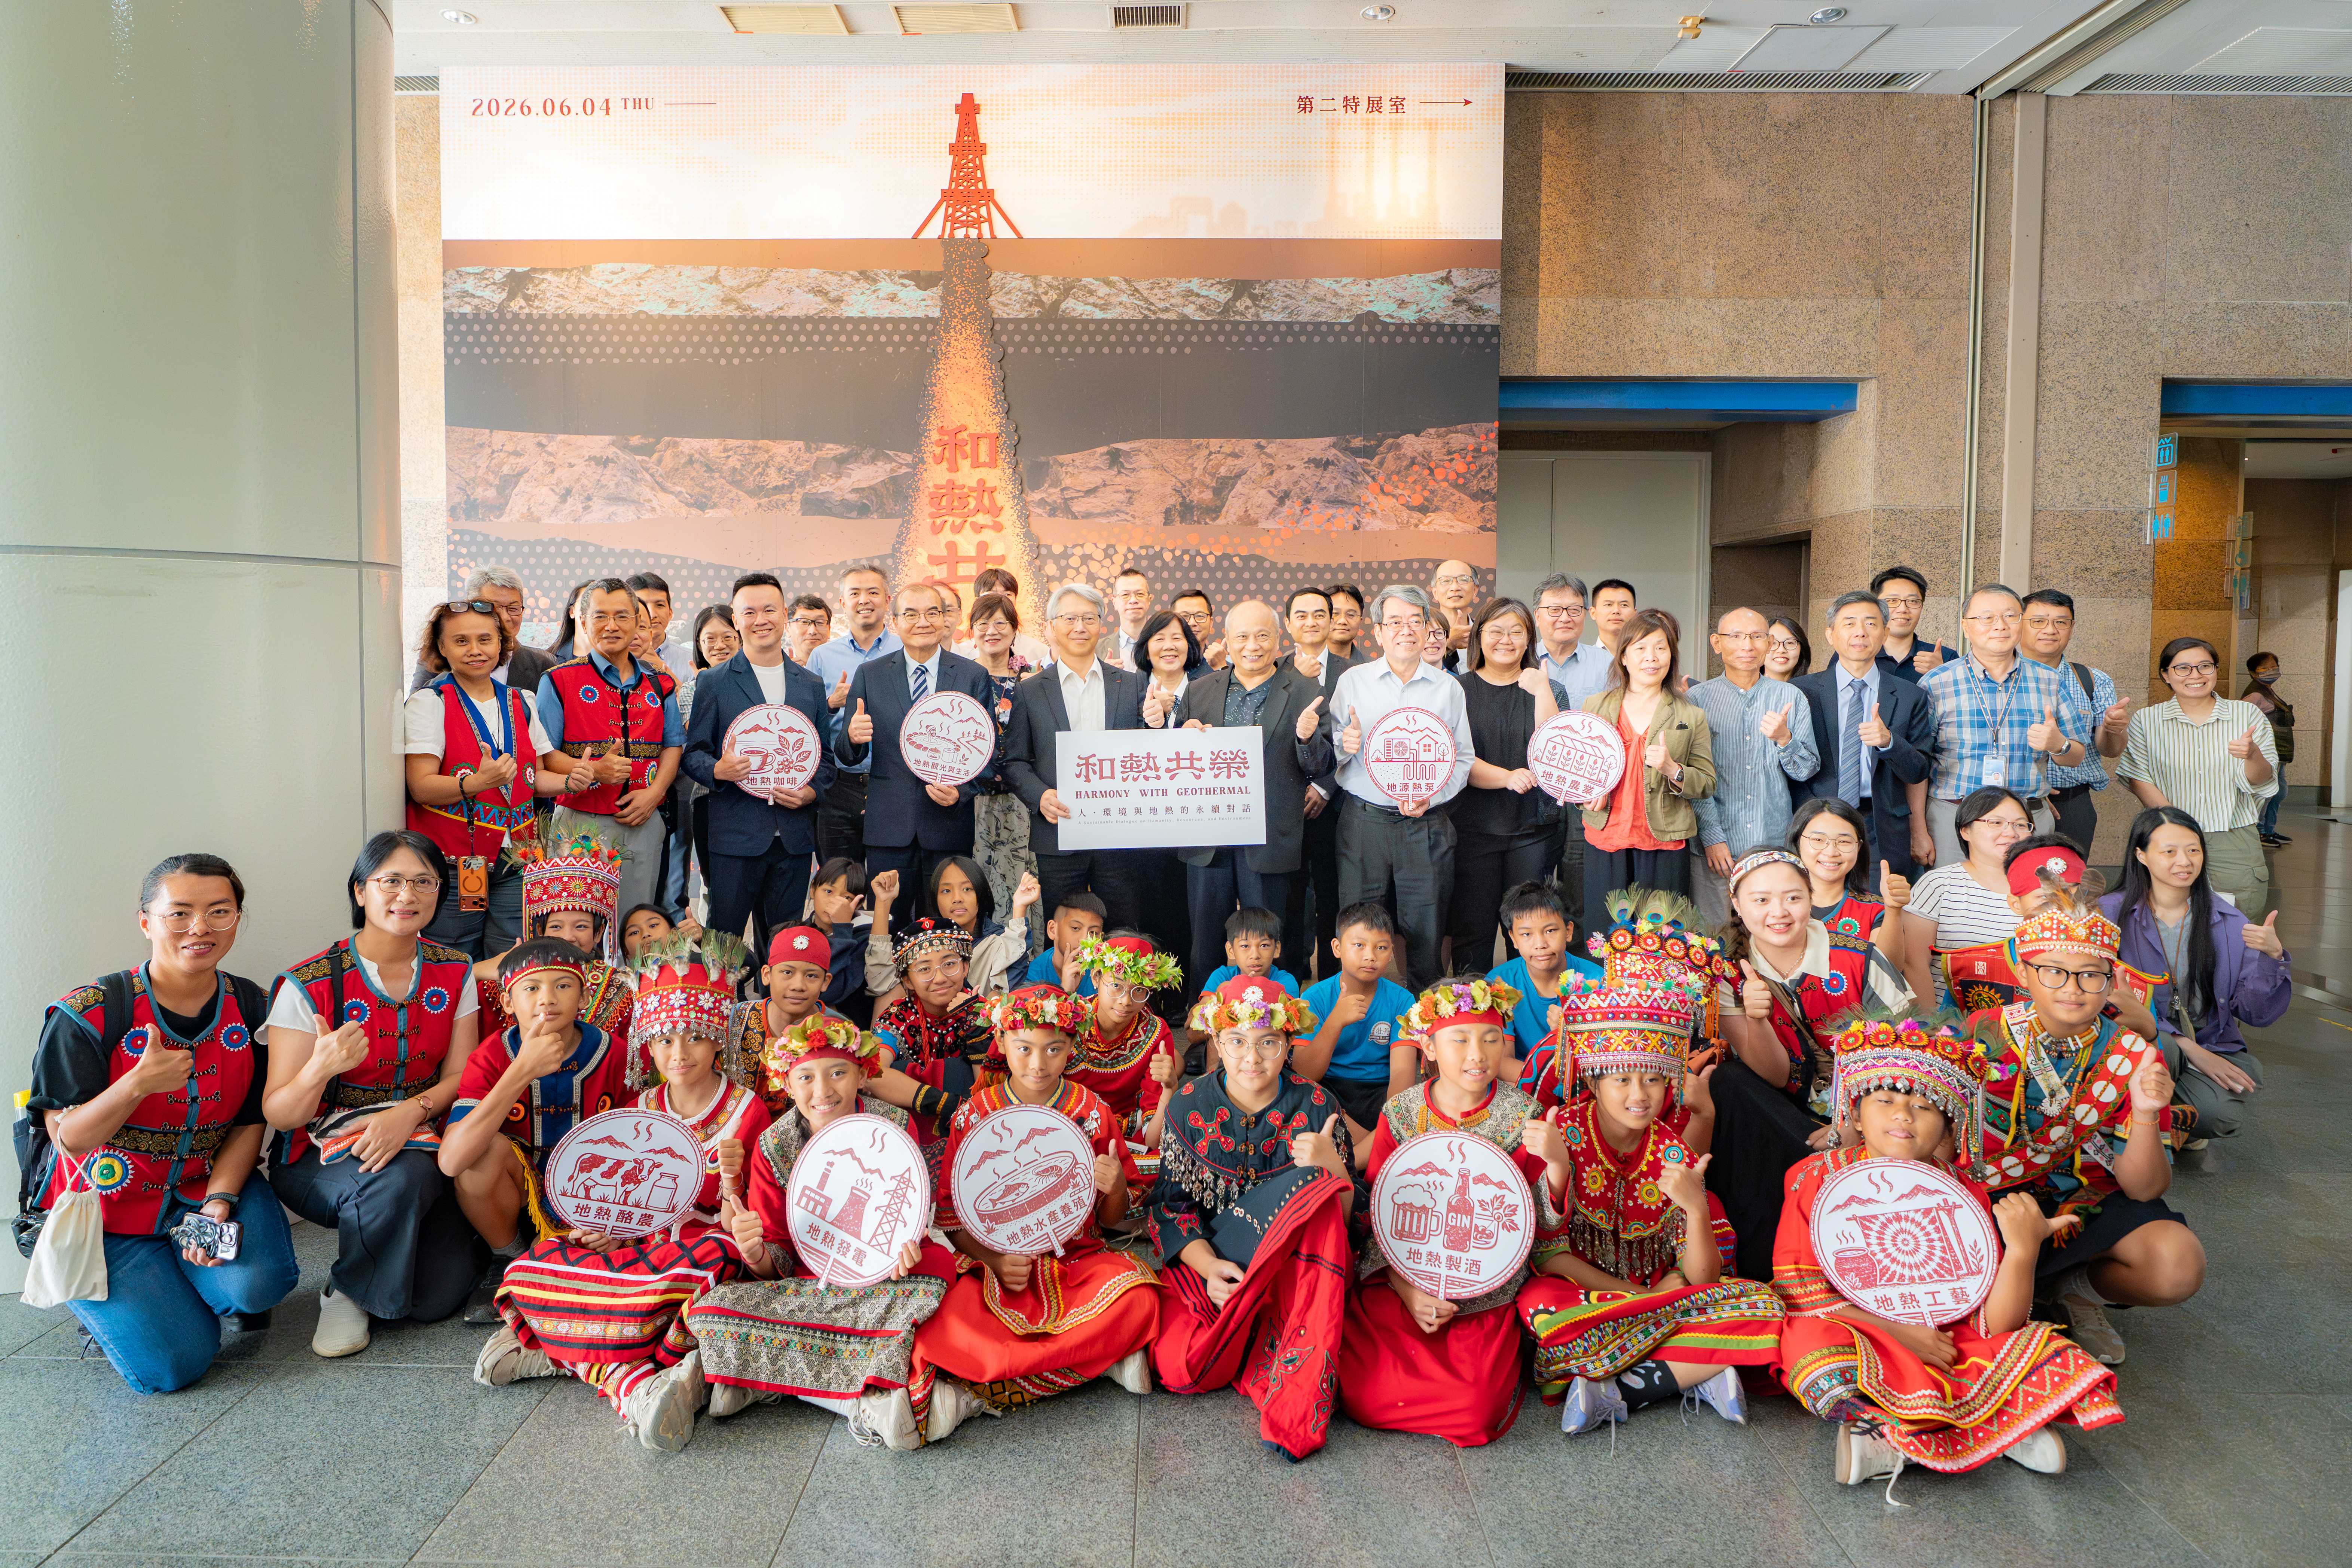
中央研究院與國立自然科學博物館(下稱科博館)合辦「和熱共榮:人.環境與地熱的永續對話」特展,今(4)日在臺中科博館熱鬧開幕。本特展首度將中研院地熱團隊的研究成果以科普形式展出,完整呈現地熱的生成、儲集與循環,以及如何透過嚴謹的地質調查與分析,掌握地下熱能的分布與潛力,進而開發為綠色電力。展覽引領觀眾思考,在追求綠能發展的同時,如何以科學為基礎,在能源需求、環境限制與地方生活之間尋求永續共榮。
AI已經能寫作文、解數學,甚至生成程式,人類要如何駕馭人工新智慧?面對極端氣候與糧食危機,農業科技創新有哪些新出路?而在民主社會中所追求的自由,究竟是權利的擴張抑或同時伴隨限制與責任的實踐?中央研究院115年「中研講堂」高雄場將於6月5日(週五)在國立鳳山高中登場,由資訊、生命與人文社會領域的研究人員,從人工智慧、農業科技到民主社會反思,與學子一同思考新世代議題與解方。活動自即日起開放報名,名額有限,歡迎踴躍報名。
本院於今(2026)年5月18日至20日與日本京都大學(KU)、美國加州大學洛杉磯校區(UCLA)共同舉辦三邊研討會。繼去(2025)年於洛杉磯首辦後,今年移師臺北,再度邀集三方頂尖學者,聚焦新材料與再生能源、生物醫學與人類健康、植物及微生物研究與農業發展等議題,透過積極對話與跨域合作,促進科研成果轉化為應對人類永續發展的具體方案。<br/><br/>首日邀請去年諾貝爾化學獎得主、日本京都大學特聘教授北川進(Kitagawa Susumu)發表專題演講,以「分子空間的設計:從金屬有機框架邁向更美好的未來(Designing Molecular Space: From MOFs to a Better Future)」為題,分享其推動金屬有機框架(metal–organic frameworks, MOFs)研究發展之歷程。
響應518國際博物館日,本院數位文化中心今(2026)年推出全新「萬象召喚」線上活動,以奇幻異世界為概念,結合生成式AI與互動設計,打造沉浸式數位探索體驗。民眾可選擇不同的「魔法符文」,開啟專屬的「開放博物館」展覽探索旅程,穿梭於遠古文明、自然生態等多元主題之中。
本院民族學研究所第六屆共作展「maine’e・鄒・回家」今(8)日在阿里山鄉鄒族自然與文化中心開幕,展出典藏於中研院民族所博物館逾半世紀的珍貴文物。本次展覽首度於原住民族地方文化館展出,並邀請部落長老同步展出私人收藏,透過對文物的田野訪查與口述紀錄,呈現鄒族生活與工藝的豐富樣貌。「maine’e」在鄒語中為「回家」之意,希望藉由文物的移動返鄉,再度連結人、文化與土地的關係。
美國哲學學會(American Philosophical Society, APS)近日公布2026年新科院士,本院廖俊智院長榮膺數理科學院士,成為本屆少數獲選的國際學者。APS每年僅從全球遴選至多10位數理科學院士,顯見此殊榮之代表性,獲選該會院士是對科學成就的高度肯定,也顯示成員對世界的智識貢獻、在科學哲學的獨創見解、對人類社會的積極影響力。
中央研究院「臺灣橋梁計畫」於昨(23)日迎來第10場講座,2015年諾貝爾物理獎得主、日本東京大學宇宙射線研究所(Institute for Cosmic Ray Research, The University of Tokyo)教授梶田隆章(Takaaki Kajita),以「基礎科學之國際合作:實務經驗分享(International Collaboration in Basic Science-From My Experience)」為題,分享科學如何跨越國界與文化、促進理解與合作,並以微中子與重力波說明人類如何拓展對宇宙的認識邊界。
量子處理器(Quantum Processing Unit, QPU)是超導量子電腦的核心。中央研究院現正致力精進超導QPU製程技術的規模化與可靠度,關鍵突破之一是在大型QPU上建立高效率、可反覆進行的測試流程。為突破傳統QPU校準方法的限制,中研院與NVIDIA近期展開合作,運用NVIDIA Ising系列AI模型,發展以人工智慧驅動的自動化校準技術,提升測試效率與系統可擴展性,為量子晶片規模化奠定基礎。
中央研究院「臺灣橋梁計畫」(Taiwan Bridges)第9場演講於昨(7)日邀請2002年諾貝爾化學獎得主庫爾特.維斯里契(Kurt Wüthrich)教授以「生命分子、人工智慧與人類健康(The Molecules of Life, AI and Human Health)」為題,分享核磁共振(NMR)解析生物分子結構的技術突破及其在精準醫療上的應用,並指出在人工智慧(AI)浪潮與科技快速發展下,持續學習與適應能力已成為重要素養。現場座無虛席,吸引逾400名研究人員與學生參與。
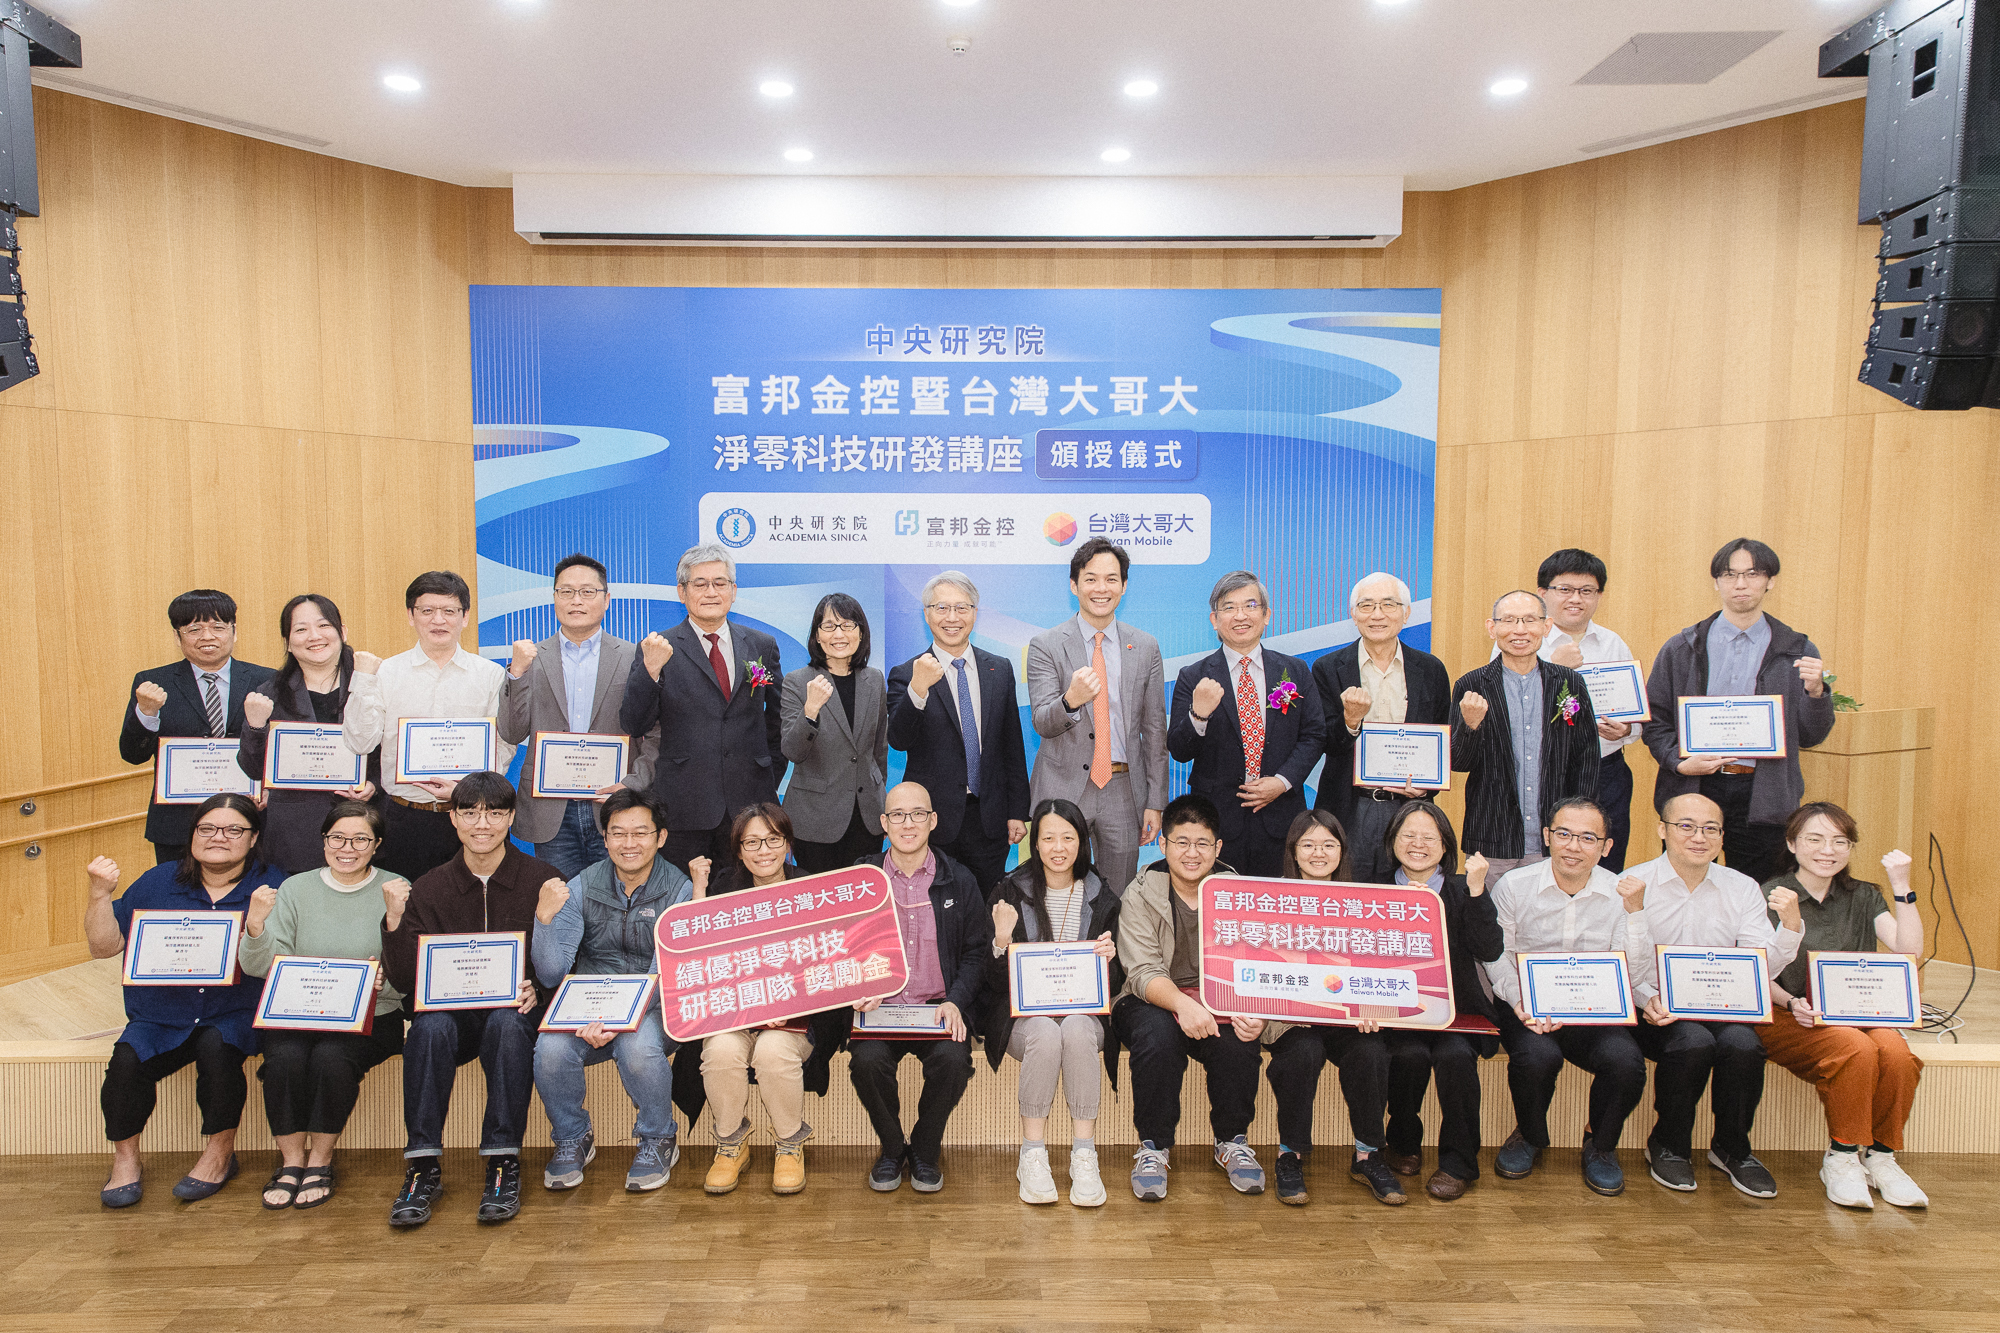
中央研究院昨(1)日頒授「中研院富邦金控暨台灣大哥大淨零科技研發講座」予「地熱Alpha計畫」主持人李建成研究員、「海洋能Alpha計畫」主持人吳朝榮研究員及郭振華研究員,並肯定32名績優淨零科技研發人員。研發講座榮銜由本院廖俊智院長、台灣大哥大林之晨總經理與富邦金控劉菁宜永續長暨人資長共同頒授。
中央研究院「臺灣橋梁計畫」第8場講座,邀請2014年諾貝爾生醫獎得主、挪威科技大學(Norwegian University of Science and Technology)教授愛德華.莫澤(Edvard I. Moser),以「大腦的GPS:我們如何知道自己身在何處(The Brain’s GPS: How We Know Where We Are)」為題,探討解開大腦如何建構空間認知系統的奧秘。
學術及儀器事務處
2026/06/01
中央研究院115年度第一次醫學研究倫理教育訓練
2026/05/27
115年度第2梯次博士後研究學者申請案核定通過名單
2026/05/25
116年度「國立臺灣大學與中央研究院創新性合作計畫」即日起至115年7月10日止受理申請
近代史研究所
2026/05/22
近代史研究所陳冠任助研究員獲選英國皇家歷史學會會士
國際事務處
2026/05/21
115年度「中央研究院人文社會科學博士候選人培育計畫核定名單」
2026/05/15
2026-2027年度本院與波蘭科學院共同徵求國際合作計畫核定公告
秘書處
2026/05/13
中研院藝文活動〉高雄市管樂團:《跨樂一甲子》流行音樂會
2026年中央研究院藝文活動表演資訊
2026/05/12
116年度「臺北、臺中、高雄榮民總醫院、三軍總醫院與中央研究院合作研究計畫」,自115年6月1日起至115年7月15日止受理申請
2026/05/08
2026年「第34屆新科院士演講」系列活動訂5月15日至9月29日舉行
2026/05/04
116年度本院新增任務導向生技研究計畫及因應流行病研究計畫,即日起受理申請
人事室
2026/05/01
本院即日起至115年6月12日止受理志願服務人員報名
社會學研究所
2026/04/30
研究調查〉「臺灣社會變遷基本調查計畫」第九期第二次正式面訪調查
2026/04/27
活動報名〉2026年知識饗宴 —朱家驊院長科普講座「量子科技與奈米科技對於現代文明的發展」
中央研究院「人文社會科學博士生菁英獎學金」自115年5月15日起至6月15日止受理線上申請,逾期恕不受理。
2026/04/21
116年度本院新增永續科學研究計畫即日起受理申請
2026/04/16
「臺灣橋梁計畫」諾貝爾獎得主系列講座「基礎科學之國際合作:實務 經驗分享」
2026/04/15
本院地球科學研究所所長由特聘研究員馬國鳳博士接任,廖院長主持交接典禮。
2026/04/14
本院職場友善辦公室成立 打造安心溝通新管道
基因體研究中心
2026/04/10
陳建仁院士榮獲2026年亞太肝臟研究學會(APASL)Okuda-Omata傑出奬
2026/04/08
曾志朗院士於第14屆華人心理學家學術研討會獲頒2026年「終身成就獎」
2026/03/26
「臺灣橋梁計畫」諾貝爾獎得主系列講座「生命分子、人工智慧與人類 健康」
2026/03/24
有學有術,鑑往知來:沙崙會議揭開百年院慶序幕
永續科學中心
2026/03/18
活動後記〉2026淨零城市展:中研院淨零及AI科研落地,能源大師Amory Lovins重磅開講!
2026/03/12
「臺灣橋梁計畫」諾貝爾獎得主系列講座「大腦的 GPS:我們如何知道 自己身在何處」
2026/03/02
活動報名〉2026年知識饗宴—王世杰院長科普講座 「當臺灣人遇上中國人與美國人:我們如何看待這段微妙的三角關係?」
關鍵議題研究中心
2026/02/26
本院關鍵中心成立「下世代高效太陽能電池技術合作聯盟」
2026/02/25
116年度本院新增前瞻計畫、深耕研究計畫、主題研究計畫、關鍵突破研究計畫即日起受理申請
2026/02/13
活動報名〉「臺灣橋梁計畫」諾貝爾獎得主系列講座「抗體革命」
本院歷史語言研究所所長由研究員陳正國博士接任,廖院長主持交接典禮。
2026/02/11
活動報名〉2026年知識饗宴—錢思亮院長科普講座 「施肥不施肥?—植物的糧食、人類的糧食與環境的永續」
2026/02/10
研究調查〉「臺灣社會變遷基本調查計畫」第九期第二次預試面訪調查
2026/02/03
活動報名〉「臺灣橋梁計畫」諾貝爾獎得主系列講座「什麼是生命?」
民族學研究所
期刊出版〉《民族學研究所資料彙編》第31期
2026/01/30
活動報名〉「中央研究院講座」2025年諾貝爾物理學獎得主演講「量子運算的產業轉型:從科研邁向產業」
2026/01/29
活動報名〉「臺灣橋梁計畫」諾貝爾獎得主系列講座「為什麼你應該喜愛基因改造食品」
化學研究所
化學所陳玉如特聘研究員榮獲HUPO「傑出蛋白質體學成就獎」
出版中心
2026/01/20
展覽訊息〉2026台北國際書展:「藍圖(Blueprint)」主題特展
2026/01/19
活動報名〉「臺灣橋梁計畫」諾貝爾獎得主系列講座「是否存在「B行星 」?—人類會移居到系外行星嗎?」
2026/01/09
活動報名〉「臺灣橋梁計畫」諾貝爾獎得主系列講座「雷射與量子物理 」
2026/01/05
研究調查〉「臺灣社會變遷基本調查計畫」第九期第一次正式面訪調查(延長公告)
2025/12/29
115年度「人文社會科學博士候選人培育計畫」自即日起受理申請
2025/12/23
活動報名〉2026年知識饗宴—蔡元培院長科普講座 「你與人工智慧:與科技共進」
生物多樣性研究中心
2025/12/22
臺灣生物多樣性資訊機構 (TaiBIF) 榮獲2025年GBIF「全球生物多樣性資訊節點獎」 肯定臺灣全球生物多樣性資料共享之貢獻
書籍出版〉《知識的幾何與光影:中央研究院建築選》
2025/12/18
國科會114年度傑出特約研究員本院獲獎名單
2025/12/10
預告修正「臺灣人體生物資料庫資料及檢體使用收費標準」
2025/12/08
活動後記〉「台灣海洋碳移除方法工作坊」圓滿成功
2025/12/03
本院分子生物研究所陳詩允助研究員獲選為歐洲分子生物組織年輕研究學者(EMBO Young Investigator)
2025/11/21
近史所與國防大學簽署學術交流備忘錄 促進戰爭與軍事史合作
活動報名〉「臺灣橋梁計畫」諾貝爾獎得主系列講座「誰能推動全球衝突相關性暴力(CRSV)的終結?— 個人故事的力量與行動主義的角色 」
活動報名〉2025年知識饗宴—胡適院長科普講座 「觸受之眼:VR電影的感官邂逅」
2025/11/18
活動後記〉「2025 AI 引領永續社會國際學術研討會暨政策實務論壇」圓滿成功
2025/11/05
活動報名〉「臺灣橋梁計畫」諾貝爾獎得主系列講座「疾病的終結?—生物醫學的非凡發展及其對人類的意涵」
2025/11/01
本院115年度「國際研究生學程(TIGP)」開始受理申請
2025/10/29
活動報名〉2025年度中央研究院講座 「黑洞:跨越學科的交會點」
2025/10/28
本院生醫轉譯研究中心主任由研究員陳建璋先生接任,廖院長主持交接典禮。
2025/10/23
中研院菁英博士生快速入學試行計畫 助青年學子延續科研之路
2025/10/08
再赴法蘭克福書展 中研院以多元學術視野開啟全球交流對話
2025/09/30
中研院自製量子計算測試平台開放申請使用
原子與分子科學研究所
2025/09/17
原子與分子科學研究所許良彥研究員榮獲美國物理聯合會《化學物理雜誌》2024年度新興研究者最佳論文獎
人文社會科學研究中心
2025/09/16
活動後記〉「2025中研GIS論壇」圓滿成功
2025/09/15
114年度中央研究院人文社會科學博士生菁英獎學金 共計21名同學獲獎
2025/09/02
研究調查〉「網路徵才詐騙:過度自信與數位素養對使用者之影響的比較研究」網路調查
2025/08/27
基因轉殖鼠核心設施_推廣與教育訓練
2025/08/20
研究調查〉「傳播調查資料庫第三期第四次青少年」調查計畫
2025/08/13
活動報名〉2025年知識饗宴—吳大猷院長科普講座 「探索花朵美麗之謎」
2025/08/08
115年度本院新增「淨零科技研發計畫」即日起至114年10月8日止受理申請
2025/08/04
本院114年模範公務人員暨工作績優人員頒獎典禮業於114年7月25日辦理完竣,茲將本年度獲獎人員之優良事蹟刊登本院網頁公開表揚
2025/07/31
研究調查〉家庭動態調查「2025年預試調查」
2025/07/23
活動後記〉本院攜手UCLA、京都大學合辦 三邊生醫研討會
2025/07/22
本院化學研究所陳玉如特聘研究員榮獲財團法人台灣生技醫藥發展基金會「115年學術講座」
語言學研究所
2025/07/21
《語言暨語言學》期刊新任編輯團隊公告
活動後記〉2025臺灣數位世代研究第二屆國際學術研討會
2025/07/17
研究調查〉「民眾對公聽會的參與意願與想法」網路調查
研究調查〉「人工智慧應用於刑事司法審判的可能與顧慮」網路調查
研究調查〉「提升臨終醫療中的病人自主權」網路調查
研究調查〉「投資與理財態度調查」網路調查
2025/07/15
活動訊息〉本院第13任院長遴選座談會
2025/07/14
中央研究院114年度第二次醫學研究倫理教育訓練
2025/07/09
本院共3位研究人員榮獲第23屆有庠科技論文獎
活動後記〉首屆「中研學術大會」圓滿落幕,跨域對話激盪合作火花
2025/07/08
中央研究院2025年國際研究生學程錄取公告
2025/07/03
演講全紀錄〉首屆中研學術大會 廖院長開幕演講
2025/06/24
歡迎參加〉本院自6月30日至7月3日首度舉辦「中研學術大會」
2025/06/23
研究調查〉「臺灣社會變遷基本調查計畫」第八期第五次正式面訪調查補訪
研究調查〉「臺灣青少年成長歷程研究」正式面訪調查
115年度本院「材料與分析科技探索計畫」,即日起受理申請
2025/06/19
114年度第2梯次「國內學人短期來院訪問研究」核定通過名單
2025/06/12
114年度第2梯次本院新增關鍵突破種子計畫核定公告
2025/06/10
本院近代史研究所與國家圖書館舊籍數位化合作締約 近代史文獻共享傳播
2025/06/09
本院近代史研究所陳冠任助研究員獲2024北美海洋史學會約翰.萊曼圖書獎
2025/06/06
114年度「中央研究院人文社會科學博士候選人培育計畫」核定名單
2025/06/02
研究調查〉「傳播調查資料庫第三期第四次」面訪調查
2025/05/29
114年度第2梯次博士後研究學者申請案核定通過名單
2025/05/26
本院114年度「胡適紀念研究講座」開始受理申請
2025/05/23
第13任院長遴選委員會-研究人員及研究技術人員代表選舉 候選人名單公告
2025/05/22
中央研究院「人文社會科學博士生菁英獎學金」自114年6月1日起至7月1日止受理線上申請,逾期恕不受理。
2025/05/15
2025-2026年度本院與波蘭科學院共同徵求國際合作計畫核定公告
2025/05/14
研究調查〉「臺灣社會變遷基本調查計畫」第九期第一次正式面訪調查
2025/05/13
本院即日起至114年6月30日止受理志願服務人員報名
2025/04/29
研究調查〉「美中對臺政策」網路調查
2025/04/28
115年度「臺北、臺中、高雄榮民總醫院、三軍總醫院與中央研究院合作研究計畫」,自114年6月2日起至114年7月15日止受理申請
總務處
2025/04/25
本院附設幼兒園114學年度招生公告
2025/04/23
中央研究院114年度第二次人文社會科學研究倫理教育訓練
2025/04/22
推動居家照護專業與永續發展—「居家護理師專業及經營管理課程」圓滿舉辦
2025/04/21
活動報名〉2025年知識饗宴—朱家驊院長科普講座 「從黑洞觀看宇宙奧秘」
2025/04/18
115年度本院新增永續科學研究計畫即日起受理申請
第12屆院務會議研究人員代表選舉當選人名單公告
2025/04/16
中研院藝文活動〉茱蒂口琴樂團「口琴說書人」
2025/04/15
研究調查〉「探討衛生所的公共衛生效益」網路調查
2025/04/11
本院人事室主任異動
農生中心高階光學顯微鏡核心設施 超解析暨共軛焦顯微鏡(Zeiss ELYRA 7 with LSM 980)服務說明會 &蔡司新機(Lattice SIM 3)展示會
2025/04/02
本院與EMBO合辦「敘述性履歷」工作坊及課程
2025/03/25
研究調查〉「傳播調查資料庫第三期第四次青少年調查預試計畫」
研究調查〉「臺灣民眾之政治社會態度」網路調查
2025/03/21
本院細胞與個體生物學研究所王漢津助研究員榮獲2024年美國李氏傳統基金會獎助金
2025/03/20
第12屆院務會議研究人員代表選舉公告
本院民族學研究所所長由研究員周玉慧博士接任,廖院長主持交接典禮。
2025/03/17
中研院藝文活動〉微光古樂集「大航海時代的古樂」
2025/03/13
中央研究院114年度第一次人文社會科學研究倫理教育訓練
中央研究院114年度第一次醫學研究倫理教育訓練
Team AS!行政團隊工作效率再升級 全力支援研究
2025/03/10
本院114年度第2梯次「獎勵國內學人短期來院訪問研究」即日起至114年4月18日受理線上申請
2025/03/05
研究調查〉「社群媒體使用」網路調查
2025/03/04
國家科學及技術委員會113年度傑出研究獎本院獲獎名單
2025/02/28
114年「國際研究生學程(TIGP)暑期實習計畫」錄取名單
2025/02/27
活動報名〉2025年知識饗宴—王世杰院長科普講座 「從民調看臺灣民眾的防衛意志」
2024/12/25
中研院新進研究人員交流會 — 鼓勵合作 跨出舒適圈 挑戰新問題
2024/12/19
2025-2026年度本院與捷克科學院共同徵求國際合作計畫核定公告
2024/12/06
2024年「中央研究院年輕學者研究成果獎」訂於12月9日舉行頒獎典禮
2024/12/02
新書出版〉《研之有物:格物窮理!中研院的 25 堂數理科學課》將舉辦新書分享會
政風室
2024/10/17
本院113年度廉能楷模人員與具體事蹟
2024/09/11
本院113年模範公務人員及工作績優人員獲選名單與個人優良事蹟表
2024/05/09
展望2030年 聚焦願景 提出策略 開始行動
2024/04/09
本院即日起至113年5月31日止受理志願服務人員報名
2024/03/29
113年「國際研究生學程(TIGP)暑期實習計畫」錄取名單
2024/03/01
研究調查〉「家庭動態調查2024年訪問計畫」面訪調查
歐美研究所
2024/02/20
美國密西根大學2024年「暑期社會研究量化方法課程」開始報名
2024/01/15
國立臺灣大學林麗瓊院士當選世界科學院2024新任院士
2023/09/13
攜手大學共創雙贏 中研院推「中研學者」計畫
院本部
2023/08/22
院長致同仁信:本院博士生獎助金提升方案
Letter from President Liao to Ph.D. Students: Supplemental Stipends for Academia Sinica Ph.D. Students
數理科學組-資訊科學研究所
資訊所-吳廸融老師實驗室
截止:2026/06/30
跨學組研究中心-生醫轉譯研究中心
臺灣人體生物資料庫
院本部-資訊服務處
資安科
截止:2026/06/21
生命科學組-分子生物研究所
陳詩允老師實驗室 誠徵學士或碩士級 研究助理 2 名
院本部-智財技轉處
商業開發暨授權組
生命科學組-植物暨微生物學研究所
【基因體學技術核心】微矩陣及次世代定序實驗室
人文及社會科學組-人文社會科學研究中心
調查研究專題中心SRDA學術調查研究資料庫
生命科學組-生物多樣性研究中心
王慧瑜副研究員研究室
林子皓副研究員研究室
陳昭倫研究員研究室
細胞動態實驗室
朱修安實驗室
數理科學組-統計科學研究所
『資料科學統計合作社』(主持人:張源俊老師)
生命科學組-細胞與個體生物學研究所
黃欣鋒老師實驗室
生命科學組-生物化學研究所
廖俊智老師實驗室
截止:2026/06/18
05/05~06/09
01:00 人文社會科學研究中心
「民眾對公聽會的參與意願與想法」網路調查
05/18~06/10
10:00 歷史語言研究所
[研習營報名] 史語所「第一屆考古研習營」招生公告
06/09~06/28
「臺灣消費者預期和政策反應調查」網路調查
06/10
10:00 人文社會科學研究中心
2026亞太新視域:物質文明系列演講|外來入侵之外:福壽螺來台的多物種遭逢史
10:00 基因體研究中心
[GRC Seminar] Bench-to-Bedside: Decoding the PDAC Ecosystem to Drive AI Diagnostics and Precision Therapeutics
11:00 物理研究所
Sensitivity of the Higgs Self-Coupling via Di-Higgs Production at Multi-TeV Muon Colliders
14:00 經濟研究所
What Does It Take? Quantifying Cross-Country Transfers in the Eurozone
06/11~06/13
09:00 民族學研究所
(5/14報名截止)數位互動與人際情感暨2026 臺灣數位世代研究第三屆學術研討會
06/11
10:00 物理研究所
Optical engineering of quantum materials
Geographies of Gender: Family and Law in Imperial Japan and Colonial Taiwan
11:00 生物化學研究所
Coding or non-coding? Illuminating the “dark matter” of the proteome
14:00 近代史研究所
Knowledge circles in colonial Hong Kong, 1945-1997
過渡金屬二硫屬化物單層材料具有直接能隙、強激子響應與電場可調控的光學特性,是發展次世代光電與量子光子元件的重要平台。然而,如何兼顧大面積製造與室溫發光調控,仍是其走向實際應用的關鍵挑戰。為突破此瓶頸,本院應用科學研究中心呂宥蓉副研究員與日本東京大學化學工程系童俊智教授合作,成功將晶圓級單晶單層二維半導體(二硫化鉬),整合於原子級平坦的氮化鉿電漿子背閘極上,發展出可在室溫下操作的新型二維材料主動調變發光平台。
本院人文社會科學研究中心編印之《人文及社會科學集刊》第38卷第1期已出版,共收錄6篇論文
A型與B型流感均對全球公共衛生構成威脅,相對較常受到關注的A型流感,B型流感病毒(IBV)的研究相對較少,IBV Victoria與Yamagata兩大譜系的持續共同流行,也使疫苗預測更具挑戰性。
一般細胞在分裂多次後,染色體端粒會逐漸縮短,最後細胞會停止分裂。然而,癌細胞會利用「替代性端粒延長機制(Alternative Lengthening of Telomeres, 簡稱ALT)維持端粒長度,避免細胞老化並持續分裂。
本院近代史研究所編印之《近代中國婦女史研究》第46期業已出版
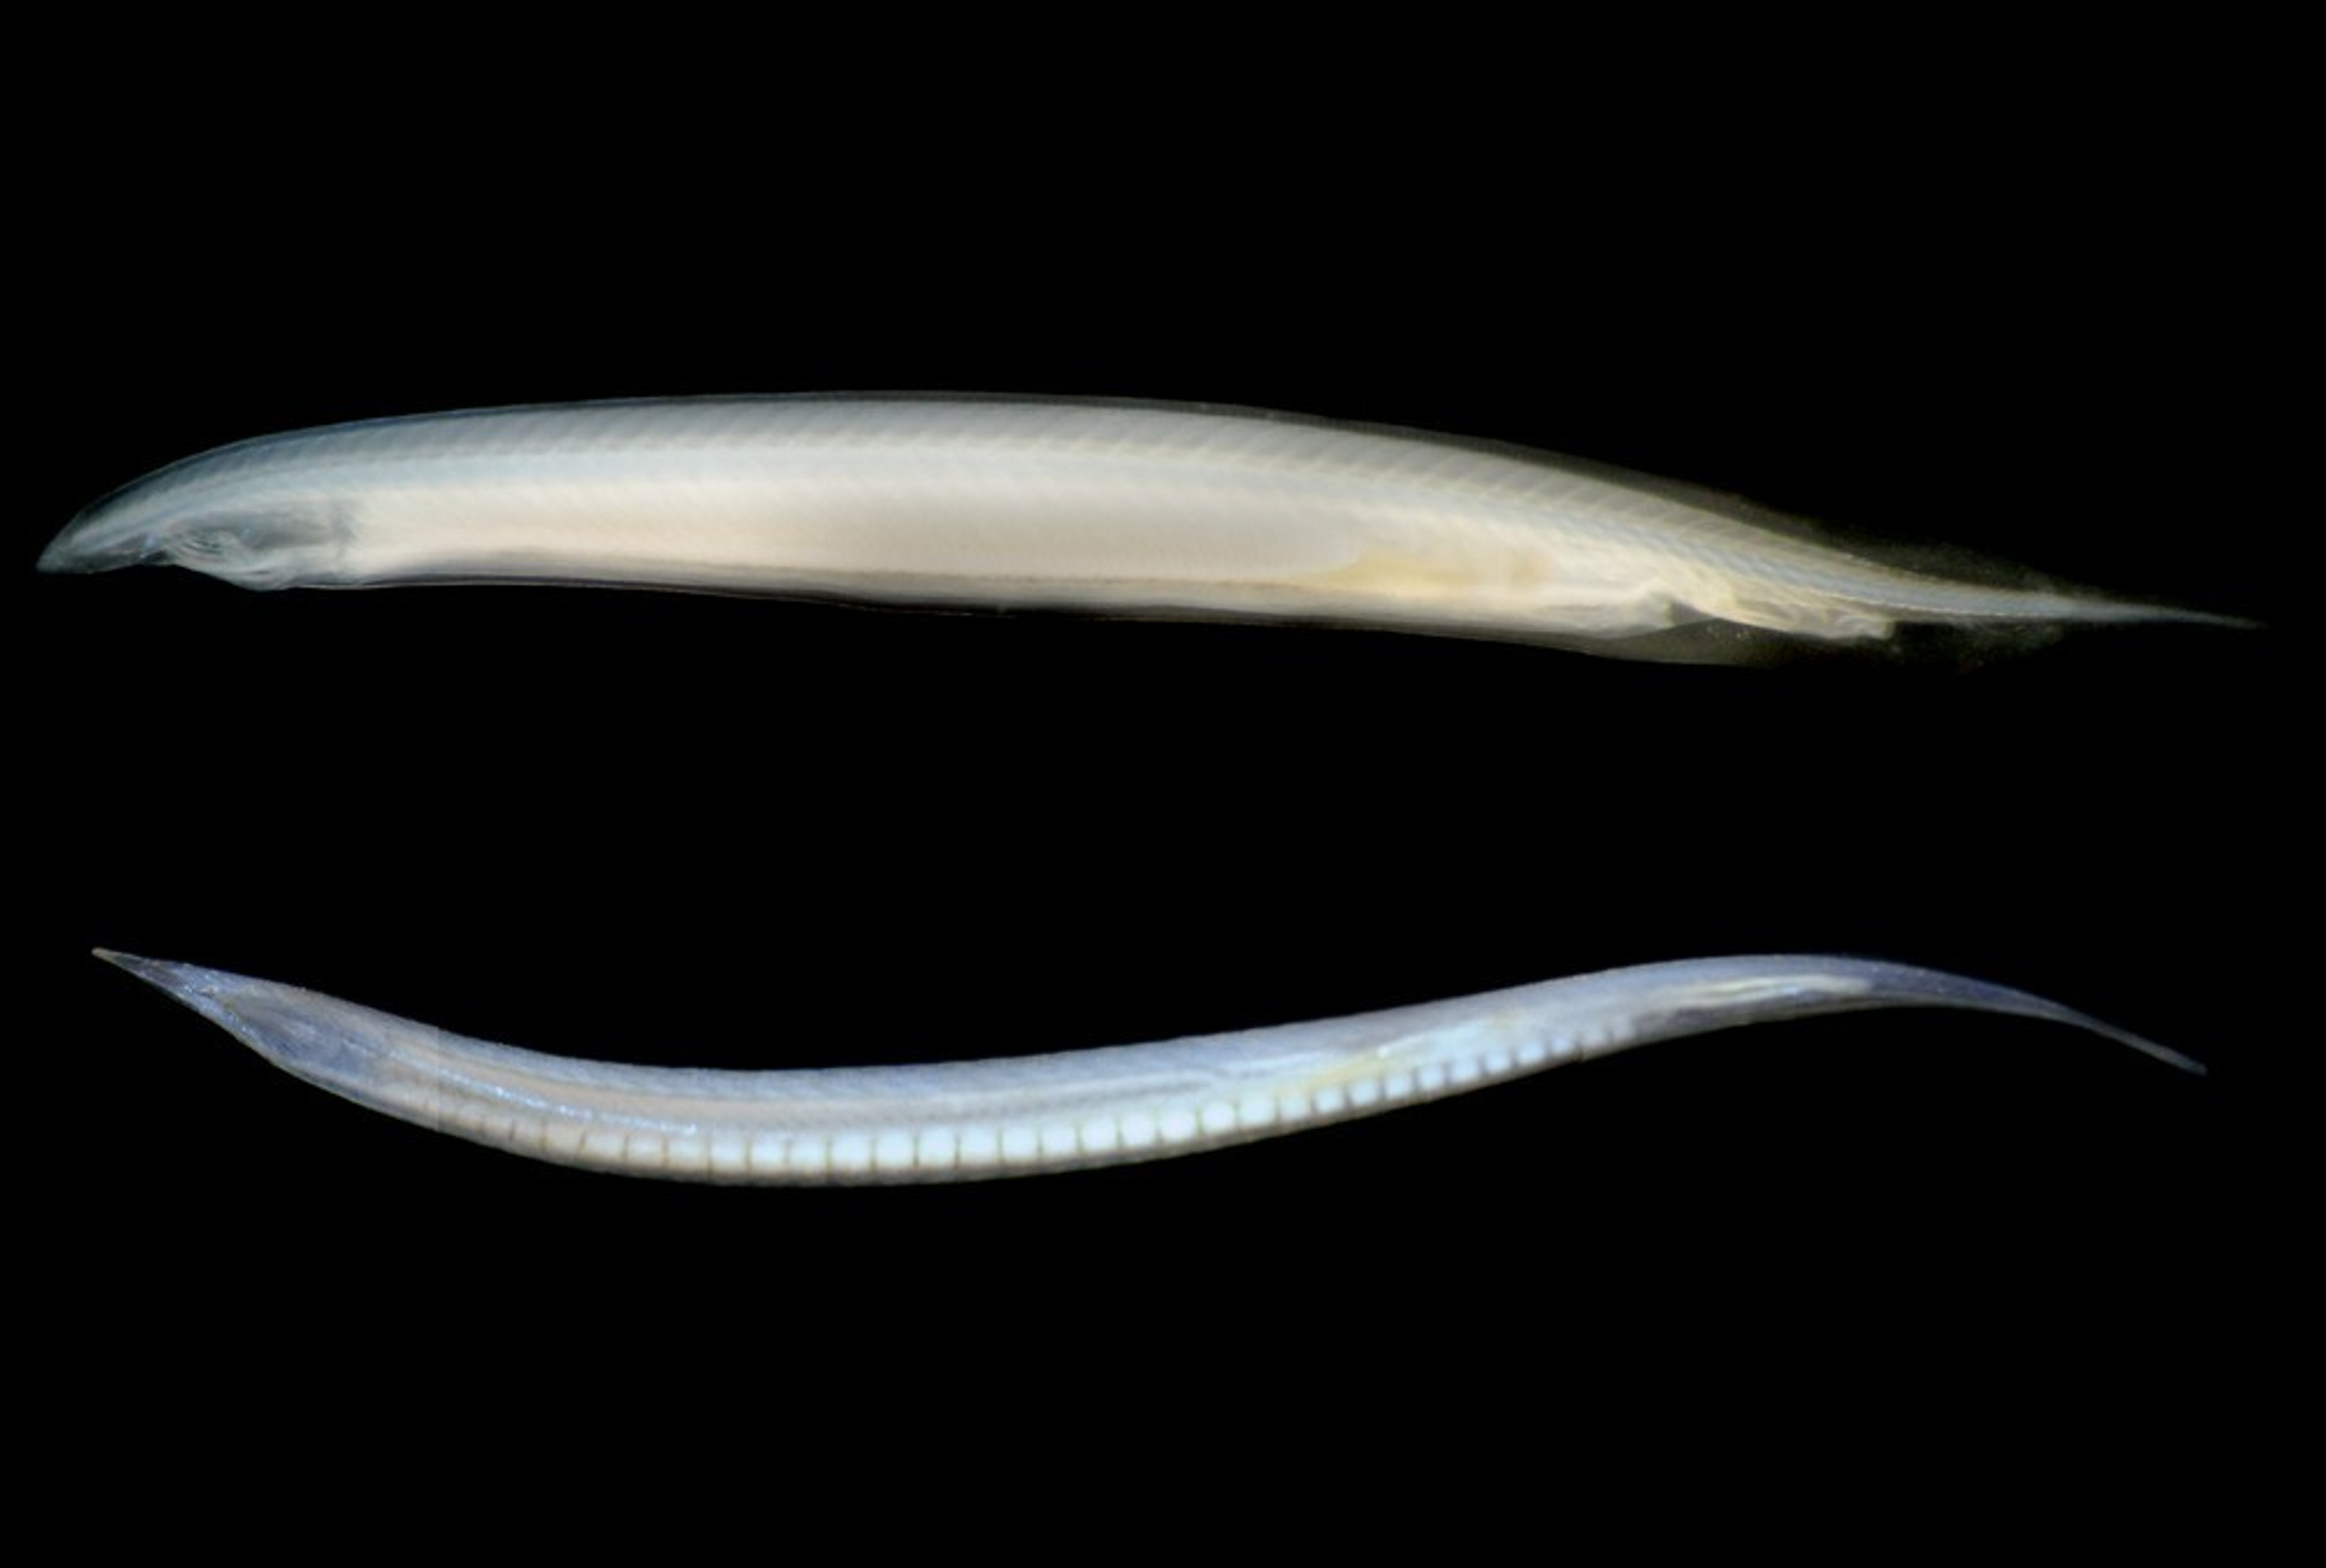
頭索動物文昌魚是脊椎動物的近親,常被用為模式生物來探討脊椎動物祖先可能具有的特徵。魯卡側殖文昌魚代表頭索動物演化上最早分支的類群,本院細生所游智凱研究員、林哲毅博士後研究學者與國際研究團隊,完成魯卡側殖文昌魚(Asymmetron lucayanum)的染色體階層基因體定序,比較基因體的結構研究發現,在頭索動物中,側殖文昌魚的基因組顯著大於過去研究的鰓口文昌魚屬(Branchiostoma)的物種。此擴張現象是由「跳躍基因」(轉座因子)的大量累積所驅動。儘管存在這些額外的DNA,其整體的基因排列順序(macro-synteny)在數億年的演化中保持得極為完整。這種穩定性很可能是因為發育過程中基因需要協同表達,因此受到選擇性限制(selective constraints)所維持的。 研究團隊亦追蹤建構身體發育藍圖的Hox基因群的演化,並辨識出脊椎動物免疫系統的古老組成要素,例如MHC和RAG基因。這項成果有助於了解無脊椎動物與脊椎動物間的重要演化轉折,為脊椎動物的基因組創新,提供極有價值的資訊。 本研究由本院關鍵突破計畫與國科會專題研究計畫支持,以及美國、韓國、中國研究機構的經費資助,本院多樣中心的高通量定序核心設施亦提供重要技術協助。論文合作者包括加州大學聖地牙哥分校Linda Holland教授,韓國中北大學Sung-Jin Cho教授,以及廣州中山大學岳家興研究員的團隊。研究成果已於2026年3月24日發表於《美國國家科學院院刊》(PNAS)。
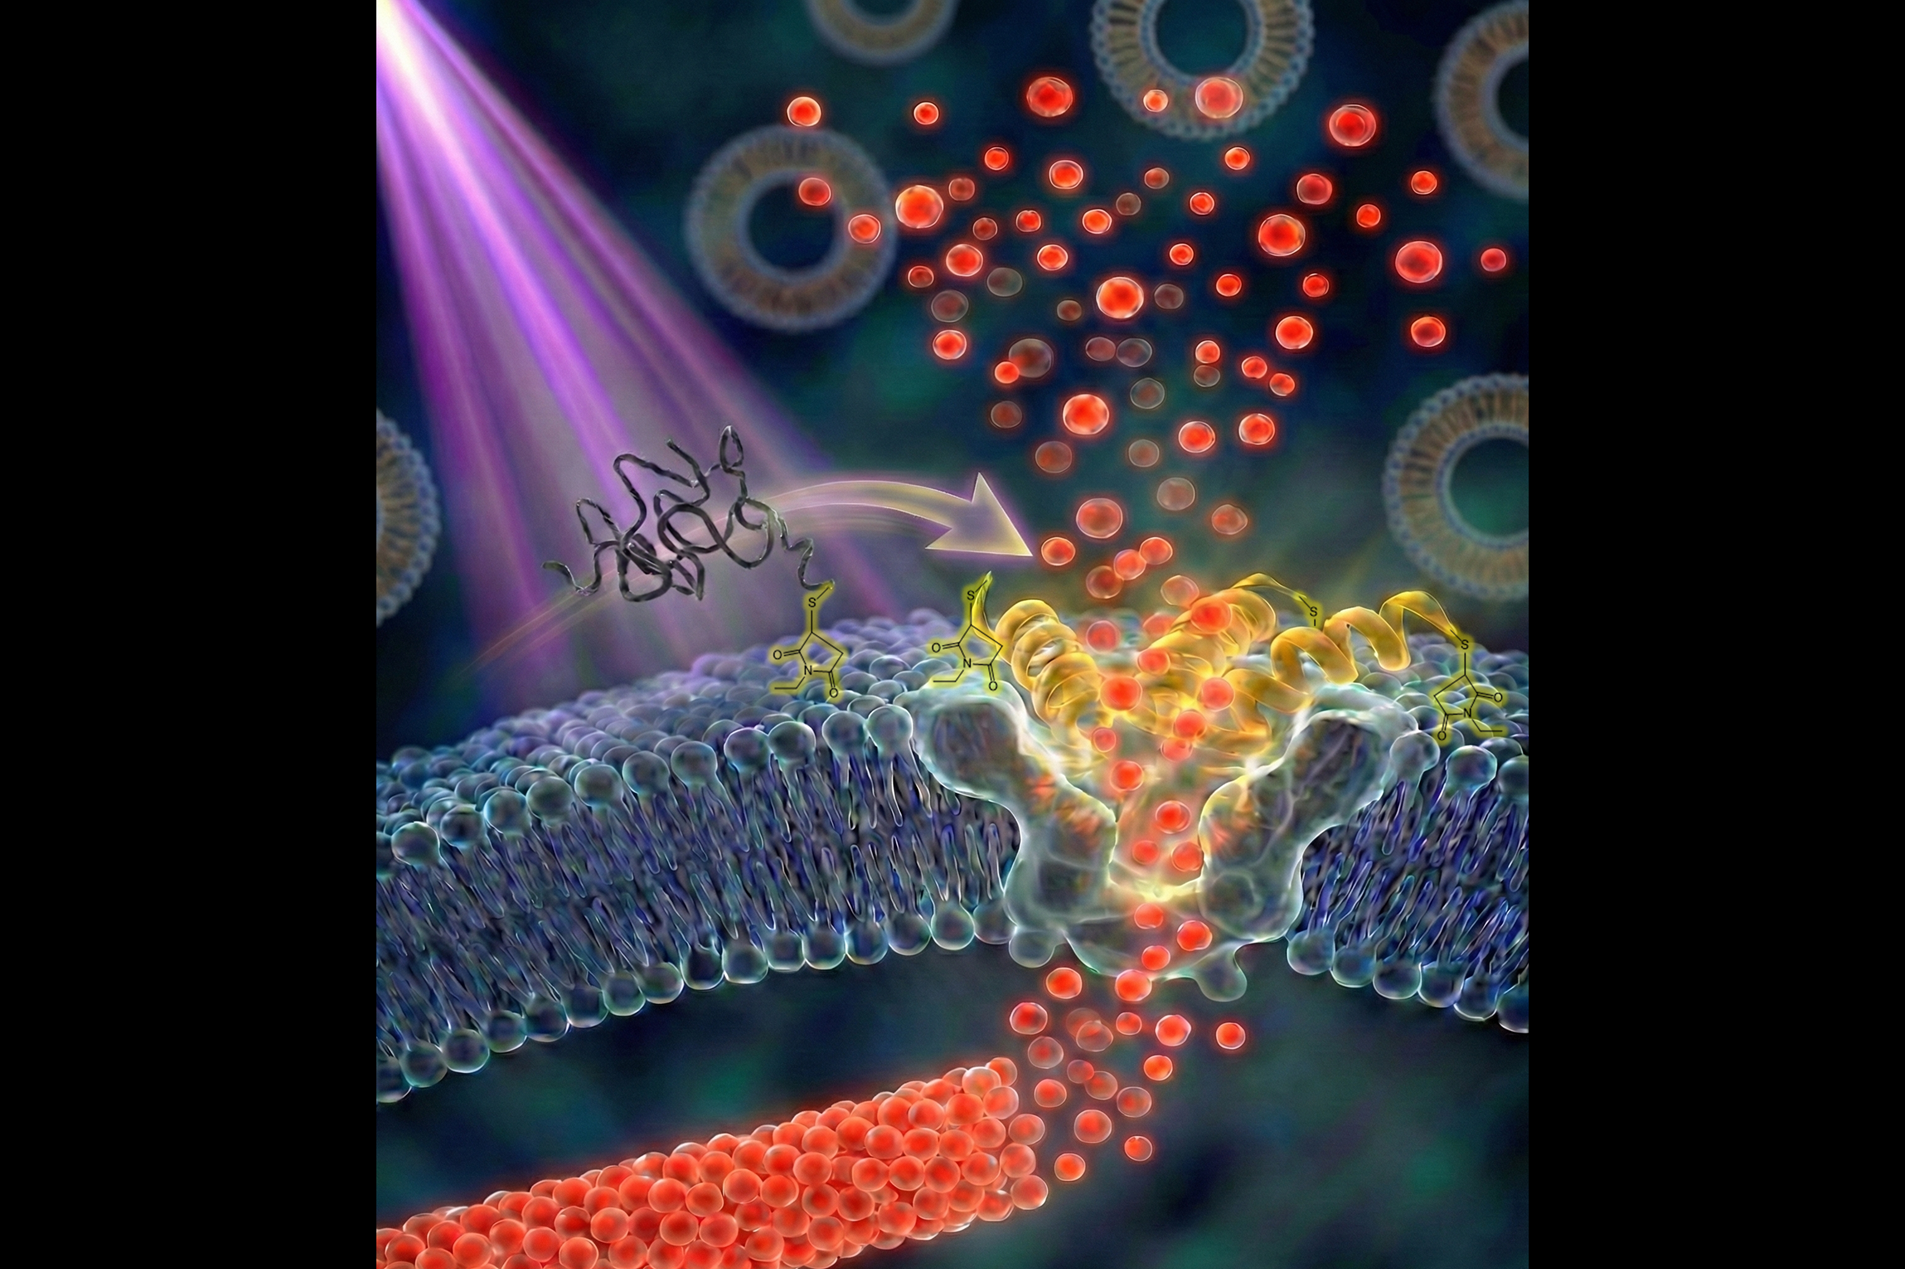
利用微脂體作為藥物傳遞載體,是現代醫學的重要技術之一。若能將具訊號感測能力的破膜胜肽整合至微脂體中,有望實現精準藥物釋放。然而,過去研究多著重於胜肽與微脂體分離狀態下的交互作用(稱為「二元系統」);至於胜肽連接到微脂體表面(即「一元系統」)時,其分子作用機制長期缺乏系統性研究,導致多肽微脂體常面臨不穩定不足及藥物提前洩漏等關鍵瓶頸。
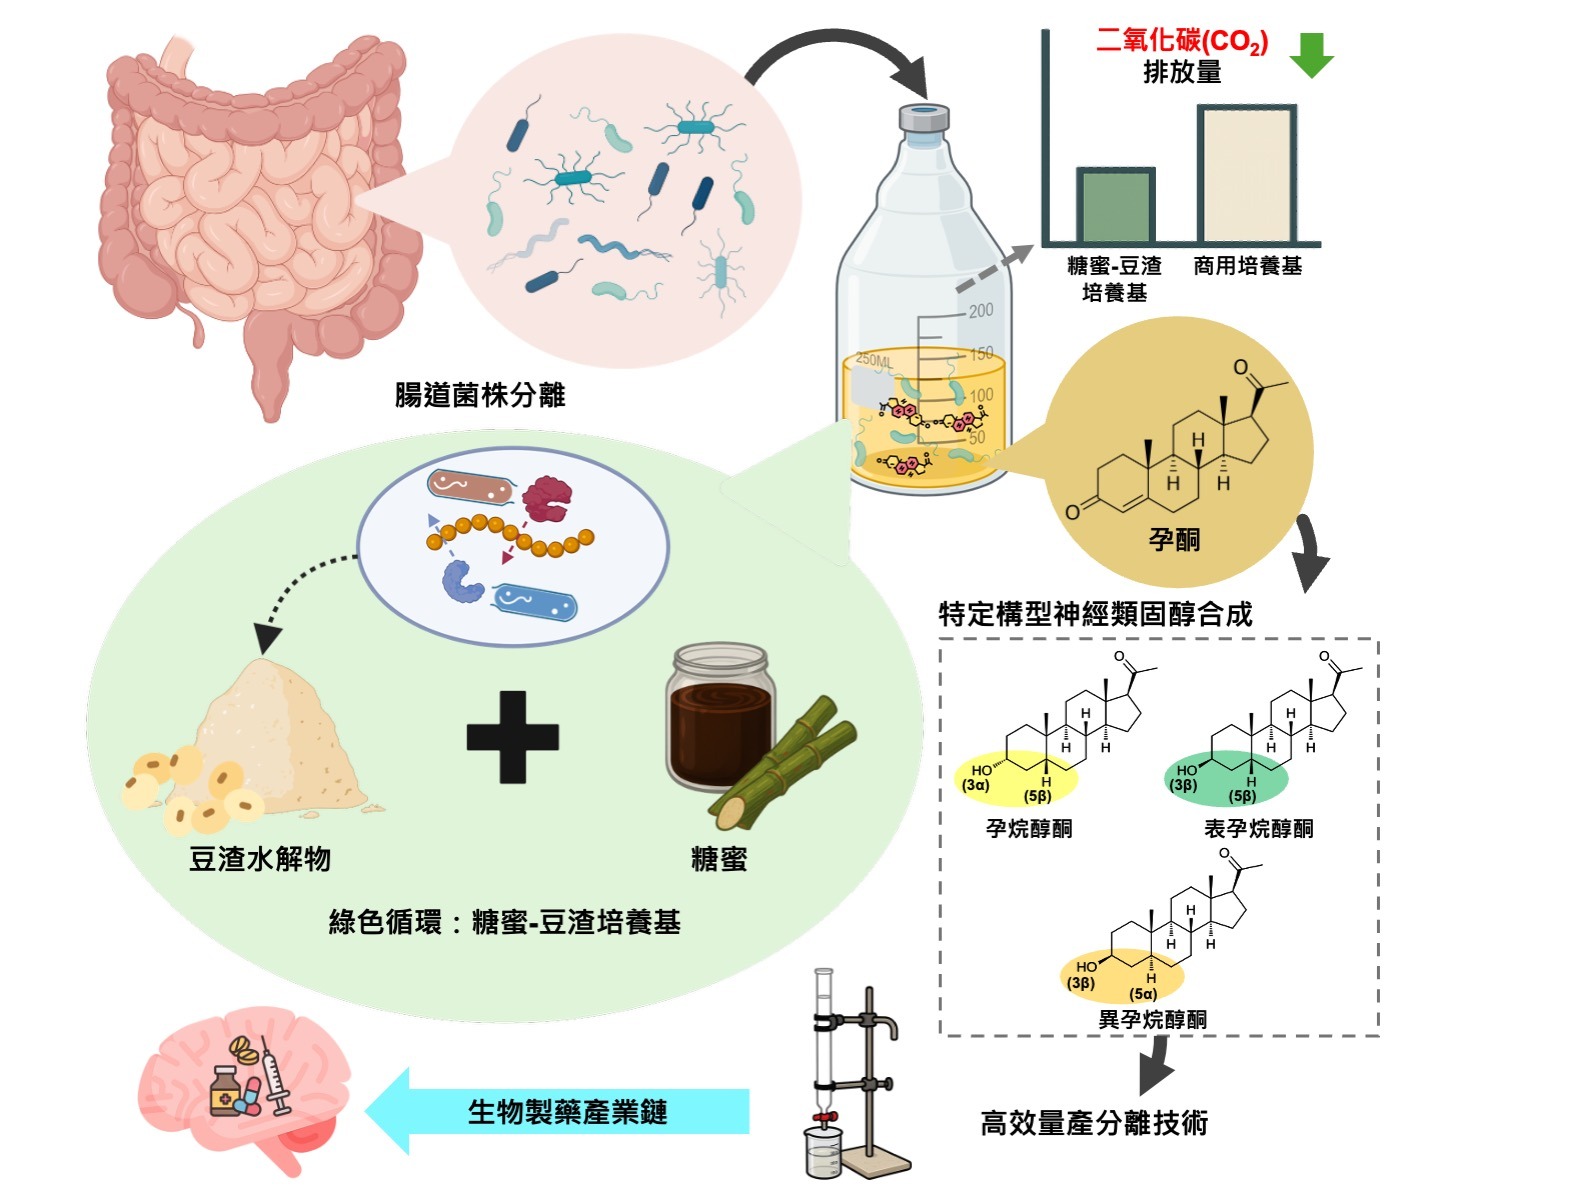
神經類固醇能調控腦部神經傳導,與焦慮、憂鬱、癲癇及經前情緒障礙等疾病密切相關。本院生物多樣性研究中心江殷儒研究員領導的跨國研究團隊,從逾3,000株人類腸道菌中篩選出具高立體選擇性的菌株,能精準合成掌性純度達99%以上的多種神經類固醇異構物。團隊利用糖蜜、豆渣等植物廢料開發低成本培養基,可簡化層析流程,大幅降低成本與碳足跡,實現多公克級量產,改善生產困難及成本問題。研究三大發現包括:腸道菌能將黃體素轉換為多種神經類固醇,顯示腸道菌相可能影響人類情緒與大腦狀態;在腸道菌中亦存在合成神經類固醇所需的5α-還原酶,且親水性更佳、更適合工業應用;建立結合微生物發酵與農業廢料的綠色製藥技術,為掌性藥物的永續生產提供新方向。 本研究由多樣中心江殷儒研究員主持,共同第一作者為多樣中心Ronnie G. Gicana博士、吳天宇與黃彥勳。共同通訊作者為成功大學化學工程學系吳意珣教授及上海交通大學生命科學技術學院王柏翔副教授。論文已於2026年4月2日發表於《生物技術趨勢》(Trends in Biotechnology)。
「卵巢透明亮細胞癌」是一種難治療且晚期存活率偏低的卵巢癌。目前僅有約一半的患者有特定基因突變(ARID1A),適合採用標靶藥物治療策略;而沒有ARID1A基因突變的患者,尚缺乏有效的治療選項。 本院基因體中心黃雯華副研究員研究團隊,發現卵巢透明亮細胞癌的致癌基因—生物時鐘基因BMAL2。研究指出,BMAL2是幫助癌細胞生長的重要分子,使癌細胞維持DNA修復能力,不容易死亡,持續生長。研究人員進一步發現小分子藥物GW833972A可以促使BMAL2蛋白質被降解,削弱癌細胞的DNA修復能力,進而無法存活。此小分子藥物GW833972A單獨使用時,具有抑制腫瘤的效果,在小鼠實驗中也顯示能有效降低癌細胞存活率、抑制腫瘤進展,且副作用相對較低。此外,在低劑量下,該分子藥物GW833972A能增強PARP抑制劑(PARPi)阻斷癌細胞DNA修復的治療效果,特別是在BMAL2表現較高的癌細胞中尤為顯著。本研究揭示BMAL2在卵巢透明亮細胞癌生長過程中的角色,也為卵巢透明亮細胞癌未來的臨床治療策略提供了極具潛力的治療靶點。 此研究第一作者為基因體中心TIGP-MCB學程國際研究生陳吟詩;通訊作者為黃雯華副研究員。研究經費由本院計畫及國科會支持,研究成果已於2026年4月3日發表於《EMBO分子醫學》(EMBO Molecular Medicine)。
本院語言學研究所期刊《語言暨語言學》第27卷第2期已出版
本院數學研究所編印之《數學傳播》季刊第50卷第1期已出版
本院數學研究所編印之《數學集刊》,第21卷第1期已出版
「中研院訊」為本院重要資訊及研究成果發布平台,每雙週出刊,協助院內同仁掌握本院最新消息,也讓院外讀者更加了解本院及相關學術研究成果。
「研之有物」為本院創立之科普平臺,以深入淺出的方式報導數理、生命及人文社會領域研究成果,分享研究人員不為人知的甘苦談。歡迎進入官網吸收新知、訂閱電子報,一起探索各領域知識!